

267
metic tissue to absorb the water and place the coverslip with
the cells first on the drop of mowiol. Let the slides dry overnight in the dark to prevent bleaching.
6. Day 2: Use nail polish to seal the samples before looking at
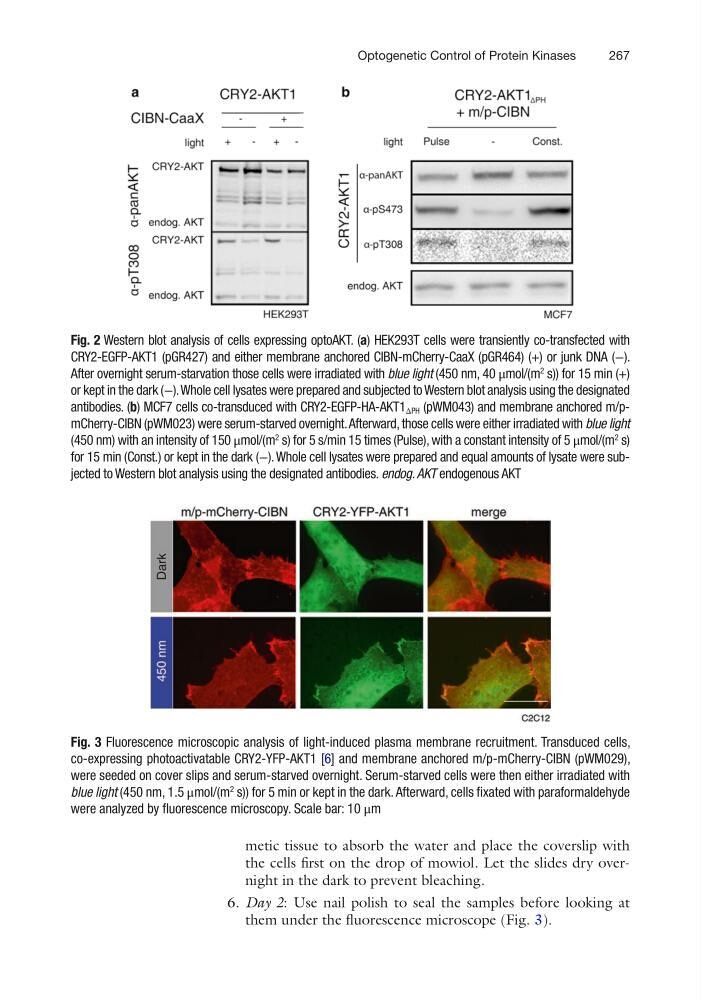
them under the fluorescence microscope (Fig. 3).
Fig. 2 Western blot analysis of cells expressing optoAKT. (a) HEK293T cells were transiently co-transfected with
CRY2-EGFP-AKT1 (pGR427) and either membrane anchored CIBN-mCherry-CaaX (pGR464) (+) or junk DNA (−).
After overnight serum-starvation those cells were irradiated with blue light (450 nm, 40 μmol/(m
2
s)) for 15 min (+)
or kept in the dark (−). Whole cell lysates were prepared and subjected to Western blot analysis using the designated
antibodies. (b) MCF7 cells co-transduced with CRY2-EGFP-HA-AKT1 ΔPH (pWM043) and membrane anchored m/pmCherry-CIBN (pWM023) were serum-starved overnight. Afterward, those cells were either irradiated with blue light
(450 nm) with an intensity of 150 μmol/(m
2
s) for 5 s/min 15 times (Pulse), with a constant intensity of 5 μmol/(m
2
s)
for 15 min (Const.) or kept in the dark (−). Whole cell lysates were prepared and equal amounts of lysate were subjected to Western blot analysis using the designated antibodies. endog. AKT endogenous AKT
Fig. 3 Fluorescence microscopic analysis of light-induced plasma membrane recruitment. Transduced cells,
co-expressing photoactivatable CRY2-YFP-AKT1 [6] and membrane anchored m/p-mCherry-CIBN (pWM029),
were seeded on cover slips and serum-starved overnight. Serum-starved cells were then either irradiated with
blue light (450 nm, 1.5 μmol/(m
2
s)) for 5 min or kept in the dark. Afterward, cells fixated with paraformaldehyde
were analyzed by fluorescence microscopy. Scale bar: 10 μm
Optogenetic Control of Protein Kinases
metic tissue to absorb the water and place the coverslip with
the cells first on the drop of mowiol. Let the slides dry overnight in the dark to prevent bleaching.
6. Day 2: Use nail polish to seal the samples before looking at
them under the fluorescence microscope (Fig. 3).
Fig. 2 Western blot analysis of cells expressing optoAKT. (a) HEK293T cells were transiently co-transfected with
CRY2-EGFP-AKT1 (pGR427) and either membrane anchored CIBN-mCherry-CaaX (pGR464) (+) or junk DNA (−).
After overnight serum-starvation those cells were irradiated with blue light (450 nm, 40 μmol/(m
2
s)) for 15 min (+)
or kept in the dark (−). Whole cell lysates were prepared and subjected to Western blot analysis using the designated
antibodies. (b) MCF7 cells co-transduced with CRY2-EGFP-HA-AKT1 ΔPH (pWM043) and membrane anchored m/pmCherry-CIBN (pWM023) were serum-starved overnight. Afterward, those cells were either irradiated with blue light
(450 nm) with an intensity of 150 μmol/(m
2
s) for 5 s/min 15 times (Pulse), with a constant intensity of 5 μmol/(m
2
s)
for 15 min (Const.) or kept in the dark (−). Whole cell lysates were prepared and equal amounts of lysate were subjected to Western blot analysis using the designated antibodies. endog. AKT endogenous AKT
Fig. 3 Fluorescence microscopic analysis of light-induced plasma membrane recruitment. Transduced cells,
co-expressing photoactivatable CRY2-YFP-AKT1 [6] and membrane anchored m/p-mCherry-CIBN (pWM029),
were seeded on cover slips and serum-starved overnight. Serum-starved cells were then either irradiated with
blue light (450 nm, 1.5 μmol/(m
2
s)) for 5 min or kept in the dark. Afterward, cells fixated with paraformaldehyde
were analyzed by fluorescence microscopy. Scale bar: 10 μm
Optogenetic Control of Protein Kinases