

139
10. All the bioluminescence measurements should be validated by
Western blotting in ATMR expressing cell lines in parallel
experiments.
1. D54-ATMR cells are expanded, trypsinized, and suspended in
serum-free media at 40 × 10
6
cells/mL. 50 μL of this suspension is injected into each flank (2 × 10
6
cells) in nude mice
using a 22-gauge needle. We usually wait until the tumor
reaches 60–100 mm
3
size (3–4 weeks) before starting the
experiments.
2. We acquire baseline bioluminescence measurements 3–6 h
before starting the treatment (Fig. 4a). Each mouse is injected
with 100 μL d-luciferin (4 mg/mL stock prepared in sterile
3.3 In Vivo Imaging
of ATM Kinase Activity
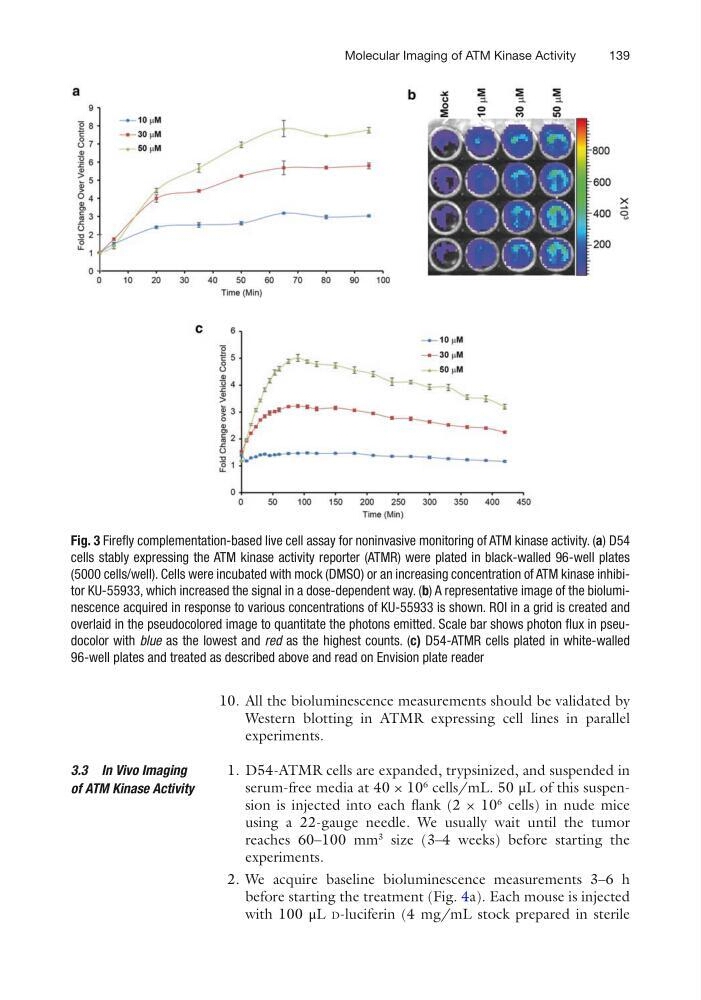
Fig. 3 Firefly complementation-based live cell assay for noninvasive monitoring of ATM kinase activity. (a) D54
cells stably expressing the ATM kinase activity reporter (ATMR) were plated in black-walled 96-well plates
(5000 cells/well). Cells were incubated with mock (DMSO) or an increasing concentration of ATM kinase inhibitor KU-55933, which increased the signal in a dose-dependent way. (b) A representative image of the bioluminescence acquired in response to various concentrations of KU-55933 is shown. ROI in a grid is created and
overlaid in the pseudocolored image to quantitate the photons emitted. Scale bar shows photon flux in pseudocolor with blue as the lowest and red as the highest counts. (c) D54-ATMR cells plated in white-walled
96-well plates and treated as described above and read on Envision plate reader
Molecular Imaging of ATM Kinase Activity
10. All the bioluminescence measurements should be validated by
Western blotting in ATMR expressing cell lines in parallel
experiments.
1. D54-ATMR cells are expanded, trypsinized, and suspended in
serum-free media at 40 × 10
6
cells/mL. 50 μL of this suspension is injected into each flank (2 × 10
6
cells) in nude mice
using a 22-gauge needle. We usually wait until the tumor
reaches 60–100 mm
3
size (3–4 weeks) before starting the
experiments.
2. We acquire baseline bioluminescence measurements 3–6 h
before starting the treatment (Fig. 4a). Each mouse is injected
with 100 μL d-luciferin (4 mg/mL stock prepared in sterile
3.3 In Vivo Imaging
of ATM Kinase Activity
Fig. 3 Firefly complementation-based live cell assay for noninvasive monitoring of ATM kinase activity. (a) D54
cells stably expressing the ATM kinase activity reporter (ATMR) were plated in black-walled 96-well plates
(5000 cells/well). Cells were incubated with mock (DMSO) or an increasing concentration of ATM kinase inhibitor KU-55933, which increased the signal in a dose-dependent way. (b) A representative image of the bioluminescence acquired in response to various concentrations of KU-55933 is shown. ROI in a grid is created and
overlaid in the pseudocolored image to quantitate the photons emitted. Scale bar shows photon flux in pseudocolor with blue as the lowest and red as the highest counts. (c) D54-ATMR cells plated in white-walled
96-well plates and treated as described above and read on Envision plate reader
Molecular Imaging of ATM Kinase Activity