

246
11 The Kapteyn Universe
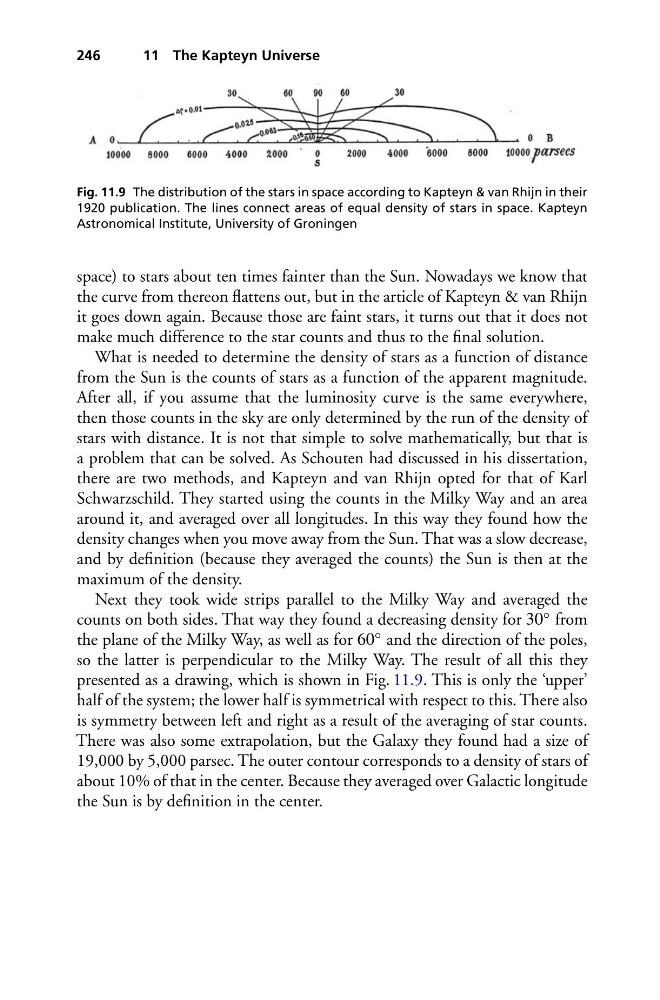
Fig. 11.9 The distribution of the stars in space according to Kapteyn & van Rhijn in their
1920 publication. The lines connect areas of equal density of stars in space. Kapteyn
Astronomical Institute, University of Groningen
space) to stars about ten times fainter than the Sun. Nowadays we know that
the curve from thereon flattens out, but in the article of Kapteyn & van Rhijn
it goes down again. Because those are faint stars, it turns out that it does not
make much difference to the star counts and thus to the final solution.
What is needed to determine the density of stars as a function of distance
from the Sun is the counts of stars as a function of the apparent magnitude.
After all, if you assume that the luminosity curve is the same everywhere,
then those counts in the sky are only determined by the run of the density of
stars with distance. It is not that simple to solve mathematically, but that is
a problem that can be solved. As Schouten had discussed in his dissertation,
there are two methods, and Kapteyn and van Rhijn opted for that of Karl
Schwarzschild. They started using the counts in the Milky Way and an area
around it, and averaged over all longitudes. In this way they found how the
density changes when you move away from the Sun. That was a slow decrease,
and by definition (because they averaged the counts) the Sun is then at the
maximum of the density.
Next they took wide strips parallel to the Milky Way and averaged the
counts on both sides. That way they found a decreasing density for 30 ◦ from
the plane of the Milky Way, as well as for 60 ◦ and the direction of the poles,
so the latter is perpendicular to the Milky Way. The result of all this they
presented as a drawing, which is shown in Fig. 11.9. This is only the ‘upper’
half of the system; the lower half is symmetrical with respect to this. There also
is symmetry between left and right as a result of the averaging of star counts.
There was also some extrapolation, but the Galaxy they found had a size of
19,000 by 5,000 parsec. The outer contour corresponds to a density of stars of
about 10% of that in the center. Because they averaged over Galactic longitude
the Sun is by definition in the center.
11 The Kapteyn Universe
Fig. 11.9 The distribution of the stars in space according to Kapteyn & van Rhijn in their
1920 publication. The lines connect areas of equal density of stars in space. Kapteyn
Astronomical Institute, University of Groningen
space) to stars about ten times fainter than the Sun. Nowadays we know that
the curve from thereon flattens out, but in the article of Kapteyn & van Rhijn
it goes down again. Because those are faint stars, it turns out that it does not
make much difference to the star counts and thus to the final solution.
What is needed to determine the density of stars as a function of distance
from the Sun is the counts of stars as a function of the apparent magnitude.
After all, if you assume that the luminosity curve is the same everywhere,
then those counts in the sky are only determined by the run of the density of
stars with distance. It is not that simple to solve mathematically, but that is
a problem that can be solved. As Schouten had discussed in his dissertation,
there are two methods, and Kapteyn and van Rhijn opted for that of Karl
Schwarzschild. They started using the counts in the Milky Way and an area
around it, and averaged over all longitudes. In this way they found how the
density changes when you move away from the Sun. That was a slow decrease,
and by definition (because they averaged the counts) the Sun is then at the
maximum of the density.
Next they took wide strips parallel to the Milky Way and averaged the
counts on both sides. That way they found a decreasing density for 30 ◦ from
the plane of the Milky Way, as well as for 60 ◦ and the direction of the poles,
so the latter is perpendicular to the Milky Way. The result of all this they
presented as a drawing, which is shown in Fig. 11.9. This is only the ‘upper’
half of the system; the lower half is symmetrical with respect to this. There also
is symmetry between left and right as a result of the averaging of star counts.
There was also some extrapolation, but the Galaxy they found had a size of
19,000 by 5,000 parsec. The outer contour corresponds to a density of stars of
about 10% of that in the center. Because they averaged over Galactic longitude
the Sun is by definition in the center.