

98
6 Laboratory and Statistical Astronomy
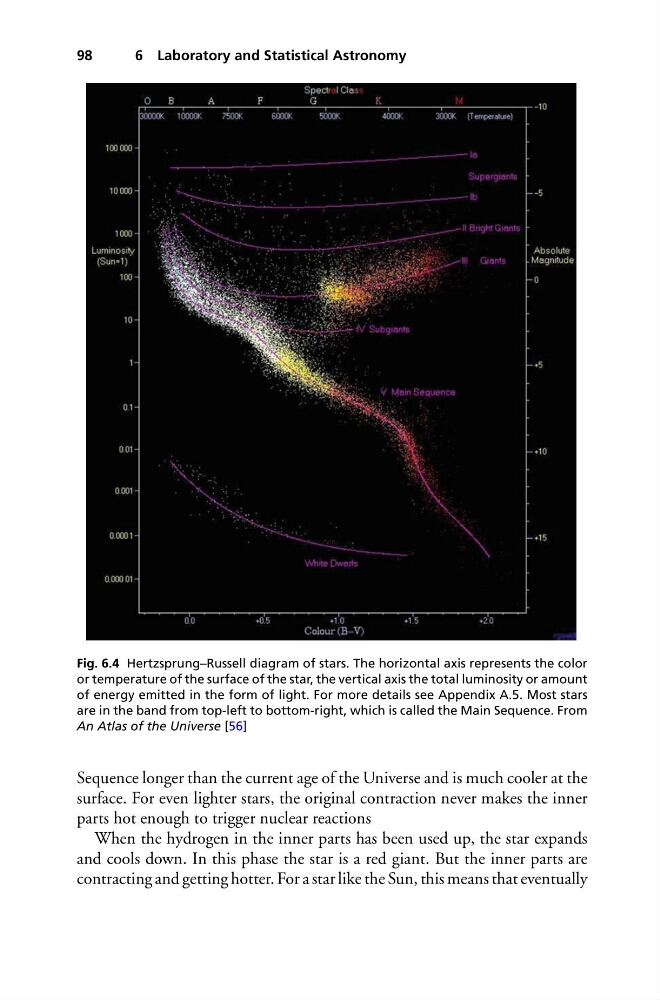
Fig. 6.4 Hertzsprung–Russell diagram of stars. The horizontal axis represents the color
or temperature of the surface of the star, the vertical axis the total luminosity or amount
of energy emitted in the form of light. For more details see Appendix A.5. Most stars
are in the band from top-left to bottom-right, which is called the Main Sequence. From
An Atlas of the Universe [56]
Sequence longer than the current age of the Universe and is much cooler at the
surface. For even lighter stars, the original contraction never makes the inner
parts hot enough to trigger nuclear reactions
When the hydrogen in the inner parts has been used up, the star expands
and cools down. In this phase the star is a red giant. But the inner parts are
contracting and getting hotter. For a star like the Sun, this means that eventually
6 Laboratory and Statistical Astronomy
Fig. 6.4 Hertzsprung–Russell diagram of stars. The horizontal axis represents the color
or temperature of the surface of the star, the vertical axis the total luminosity or amount
of energy emitted in the form of light. For more details see Appendix A.5. Most stars
are in the band from top-left to bottom-right, which is called the Main Sequence. From
An Atlas of the Universe [56]
Sequence longer than the current age of the Universe and is much cooler at the
surface. For even lighter stars, the original contraction never makes the inner
parts hot enough to trigger nuclear reactions
When the hydrogen in the inner parts has been used up, the star expands
and cools down. In this phase the star is a red giant. But the inner parts are
contracting and getting hotter. For a star like the Sun, this means that eventually