

3.2 Experimental Implementation and Analysis Methodology
63
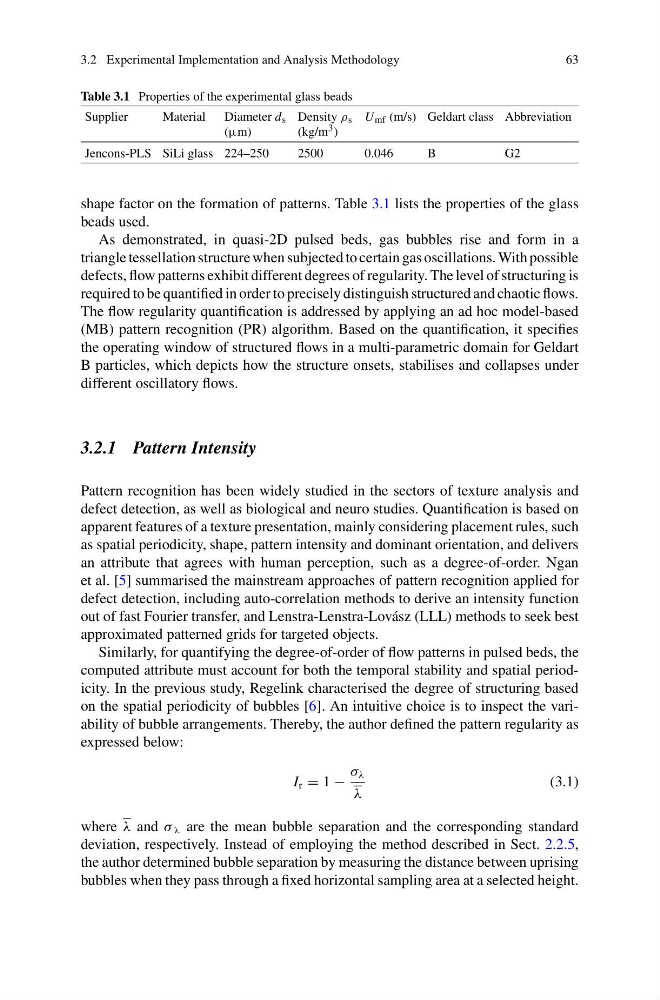
Table 3.1 Properties of the experimental glass beads
Supplier
Material Diameter d s
(μm)
Density ρ s
(kg/m 3 )
U mf (m/s) Geldart class Abbreviation
Jencons-PLS SiLi glass 224–250
2500
0.046
B
G2
shape factor on the formation of patterns. Table 3.1 lists the properties of the glass
beads used.
As demonstrated, in quasi-2D pulsed beds, gas bubbles rise and form in a
triangle tessellation structure when subjected to certain gas oscillations. With possible
defects, flow patterns exhibit different degrees of regularity. The level of structuring is
required to be quantified in order to precisely distinguish structured and chaotic flows.
The flow regularity quantification is addressed by applying an ad hoc model-based
(MB) pattern recognition (PR) algorithm. Based on the quantification, it specifies
the operating window of structured flows in a multi-parametric domain for Geldart
B particles, which depicts how the structure onsets, stabilises and collapses under
different oscillatory flows.
3.2.1 Pattern Intensity
Pattern recognition has been widely studied in the sectors of texture analysis and
defect detection, as well as biological and neuro studies. Quantification is based on
apparent features of a texture presentation, mainly considering placement rules, such
as spatial periodicity, shape, pattern intensity and dominant orientation, and delivers
an attribute that agrees with human perception, such as a degree-of-order. Ngan
et al. [5] summarised the mainstream approaches of pattern recognition applied for
defect detection, including auto-correlation methods to derive an intensity function
out of fast Fourier transfer, and Lenstra-Lenstra-Lovász (LLL) methods to seek best
approximated patterned grids for targeted objects.
Similarly, for quantifying the degree-of-order of flow patterns in pulsed beds, the
computed attribute must account for both the temporal stability and spatial periodicity. In the previous study, Regelink characterised the degree of structuring based
on the spatial periodicity of bubbles [6]. An intuitive choice is to inspect the variability of bubble arrangements. Thereby, the author defined the pattern regularity as
expressed below:
I r = 1 −
σ λ
λ
(3.1)
where λ and σ λ are the mean bubble separation and the corresponding standard
deviation, respectively. Instead of employing the method described in Sect. 2.2.5,
the author determined bubble separation by measuring the distance between uprising
bubbles when they pass through a fixed horizontal sampling area at a selected height.
63
Table 3.1 Properties of the experimental glass beads
Supplier
Material Diameter d s
(μm)
Density ρ s
(kg/m 3 )
U mf (m/s) Geldart class Abbreviation
Jencons-PLS SiLi glass 224–250
2500
0.046
B
G2
shape factor on the formation of patterns. Table 3.1 lists the properties of the glass
beads used.
As demonstrated, in quasi-2D pulsed beds, gas bubbles rise and form in a
triangle tessellation structure when subjected to certain gas oscillations. With possible
defects, flow patterns exhibit different degrees of regularity. The level of structuring is
required to be quantified in order to precisely distinguish structured and chaotic flows.
The flow regularity quantification is addressed by applying an ad hoc model-based
(MB) pattern recognition (PR) algorithm. Based on the quantification, it specifies
the operating window of structured flows in a multi-parametric domain for Geldart
B particles, which depicts how the structure onsets, stabilises and collapses under
different oscillatory flows.
3.2.1 Pattern Intensity
Pattern recognition has been widely studied in the sectors of texture analysis and
defect detection, as well as biological and neuro studies. Quantification is based on
apparent features of a texture presentation, mainly considering placement rules, such
as spatial periodicity, shape, pattern intensity and dominant orientation, and delivers
an attribute that agrees with human perception, such as a degree-of-order. Ngan
et al. [5] summarised the mainstream approaches of pattern recognition applied for
defect detection, including auto-correlation methods to derive an intensity function
out of fast Fourier transfer, and Lenstra-Lenstra-Lovász (LLL) methods to seek best
approximated patterned grids for targeted objects.
Similarly, for quantifying the degree-of-order of flow patterns in pulsed beds, the
computed attribute must account for both the temporal stability and spatial periodicity. In the previous study, Regelink characterised the degree of structuring based
on the spatial periodicity of bubbles [6]. An intuitive choice is to inspect the variability of bubble arrangements. Thereby, the author defined the pattern regularity as
expressed below:
I r = 1 −
σ λ
λ
(3.1)
where λ and σ λ are the mean bubble separation and the corresponding standard
deviation, respectively. Instead of employing the method described in Sect. 2.2.5,
the author determined bubble separation by measuring the distance between uprising
bubbles when they pass through a fixed horizontal sampling area at a selected height.