

40
2 Bubbling Properties in Pulsed Fluidised Beds
Table 2.2 Properties of the experimental glass beads
Supplier
Material Diameter d s
(μm)
Density ρ s
(kg/m 3 )
U mf (m/s) Geldart class Abbreviation
Jencons-PLS SiLi glass 224–250
2500
0.046
B
G2
2.2.5 Image Analysis
The image analysis is commonly implemented to visualise and measure the characteristics of bubble flows. Detailed properties, such as size, rising velocity, and
number of coexisting bubbles, can be extracted directly from images. The images
recorded contain 1920 pixels for the bed width, resulting in a resolution of approximately 0.23 mm per pixel. The camera captures images in a monochrome format
with a grayscale assigned for each pixel. However, a linear correlation between
the light intensity and the local solid fraction does not hold in experiments [2].
Instead, recorded frames are converted into a series of binary images using a threshold
computed based on the ISODATA algorithm [13]. Binary images clearly distinguish
the emulsion and the bubble phase. Bubbles are then identified with the particle
analyser function of ImageJ v1.52a, and an in-house Matlab code is used to facilitate
post-processing of bubble size and rising velocity computation. Given the quality of
raw images, it yields only 5% relative error in the measured bubble size if offsetting
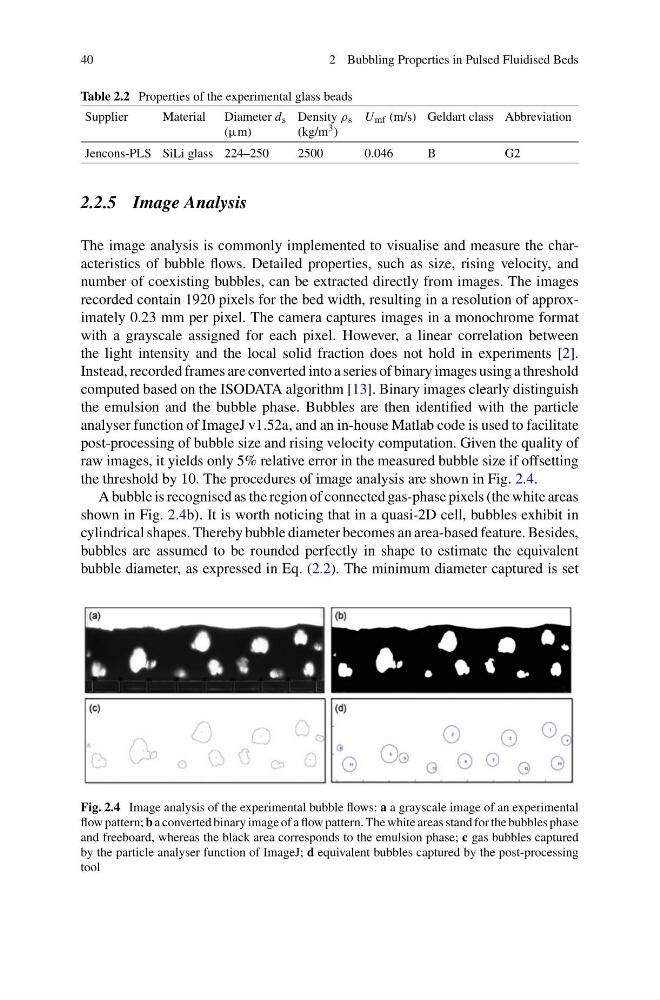
the threshold by 10. The procedures of image analysis are shown in Fig. 2.4.
A bubble is recognised as the region of connected gas-phase pixels (the white areas
shown in Fig. 2.4b). It is worth noticing that in a quasi-2D cell, bubbles exhibit in
cylindrical shapes. Thereby bubble diameter becomes an area-based feature. Besides,
bubbles are assumed to be rounded perfectly in shape to estimate the equivalent
bubble diameter, as expressed in Eq. (2.2). The minimum diameter captured is set
Fig. 2.4 Image analysis of the experimental bubble flows: a a grayscale image of an experimental
flow pattern; b a converted binary image of a flow pattern. The white areas stand for the bubbles phase
and freeboard, whereas the black area corresponds to the emulsion phase; c gas bubbles captured
by the particle analyser function of ImageJ; d equivalent bubbles captured by the post-processing
tool
2 Bubbling Properties in Pulsed Fluidised Beds
Table 2.2 Properties of the experimental glass beads
Supplier
Material Diameter d s
(μm)
Density ρ s
(kg/m 3 )
U mf (m/s) Geldart class Abbreviation
Jencons-PLS SiLi glass 224–250
2500
0.046
B
G2
2.2.5 Image Analysis
The image analysis is commonly implemented to visualise and measure the characteristics of bubble flows. Detailed properties, such as size, rising velocity, and
number of coexisting bubbles, can be extracted directly from images. The images
recorded contain 1920 pixels for the bed width, resulting in a resolution of approximately 0.23 mm per pixel. The camera captures images in a monochrome format
with a grayscale assigned for each pixel. However, a linear correlation between
the light intensity and the local solid fraction does not hold in experiments [2].
Instead, recorded frames are converted into a series of binary images using a threshold
computed based on the ISODATA algorithm [13]. Binary images clearly distinguish
the emulsion and the bubble phase. Bubbles are then identified with the particle
analyser function of ImageJ v1.52a, and an in-house Matlab code is used to facilitate
post-processing of bubble size and rising velocity computation. Given the quality of
raw images, it yields only 5% relative error in the measured bubble size if offsetting
the threshold by 10. The procedures of image analysis are shown in Fig. 2.4.
A bubble is recognised as the region of connected gas-phase pixels (the white areas
shown in Fig. 2.4b). It is worth noticing that in a quasi-2D cell, bubbles exhibit in
cylindrical shapes. Thereby bubble diameter becomes an area-based feature. Besides,
bubbles are assumed to be rounded perfectly in shape to estimate the equivalent
bubble diameter, as expressed in Eq. (2.2). The minimum diameter captured is set
Fig. 2.4 Image analysis of the experimental bubble flows: a a grayscale image of an experimental
flow pattern; b a converted binary image of a flow pattern. The white areas stand for the bubbles phase
and freeboard, whereas the black area corresponds to the emulsion phase; c gas bubbles captured
by the particle analyser function of ImageJ; d equivalent bubbles captured by the post-processing
tool