

150
Appendix B
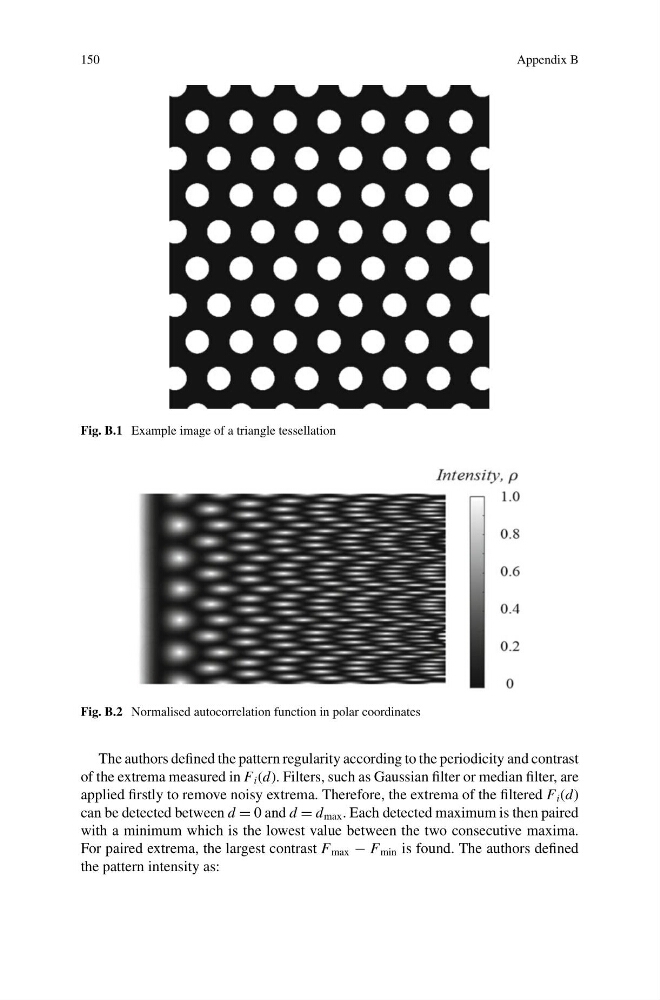
Fig. B.1 Example image of a triangle tessellation
Fig. B.2 Normalised autocorrelation function in polar coordinates
The authors defined the pattern regularity according to the periodicity and contrast
of the extrema measured in F i (d). Filters, such as Gaussian filter or median filter, are
applied firstly to remove noisy extrema. Therefore, the extrema of the filtered F i (d)
can be detected between d = 0 and d = d max . Each detected maximum is then paired
with a minimum which is the lowest value between the two consecutive maxima.
For paired extrema, the largest contrast F max − F min is found. The authors defined
the pattern intensity as:
Appendix B
Fig. B.1 Example image of a triangle tessellation
Fig. B.2 Normalised autocorrelation function in polar coordinates
The authors defined the pattern regularity according to the periodicity and contrast
of the extrema measured in F i (d). Filters, such as Gaussian filter or median filter, are
applied firstly to remove noisy extrema. Therefore, the extrema of the filtered F i (d)
can be detected between d = 0 and d = d max . Each detected maximum is then paired
with a minimum which is the lowest value between the two consecutive maxima.
For paired extrema, the largest contrast F max − F min is found. The authors defined
the pattern intensity as: