

Table 1.3 The rate and leading causes of honey bee mortality
Winter (from
October to
April)
Total
mortality
rate
Acceptable
mortality rate Reported leading causes of mortality
2006/2007
32.0%
2007/2008
36.0%
2008/2009
29.0%
26% reported having at least one CCD loss.
2009/2010
33.8%
14.4%
28% reported having at least one CCD loss.
Only 5% of beekeepers attributed CCD as the
major cause for their losses.
Starvation, weather, weak colonies in the fall,
poor queens were listed as other causes.
2010/2011
30.0%
13.0%
31% reported having at least one CCD loss.
2011/2012
21.9%
13.6%
Poor wintering conditions, CCD, pesticides,
weak condition in the fall, queen failure.
2012/2013
30.5%
14%
Queen failure, pesticides, starvation, weak colony in the fall.
2013/2014
23.2%
18.9%
Queen failure, poor winter conditions, Varroa
mites.
2014/2015
23.1%
18.7%
Mites (noncommercial).
Nine-year
average
28.7%
Source: Bee Informed Partnership [53]
0.0%
5.0%
10.0%
15.0%
20.0%
25.0%
30.0%
35.0%
40.0%
45.0%
50.0%
Acceptable Level of
Bee Loss
Total Winter Loss
Total Annual Loss
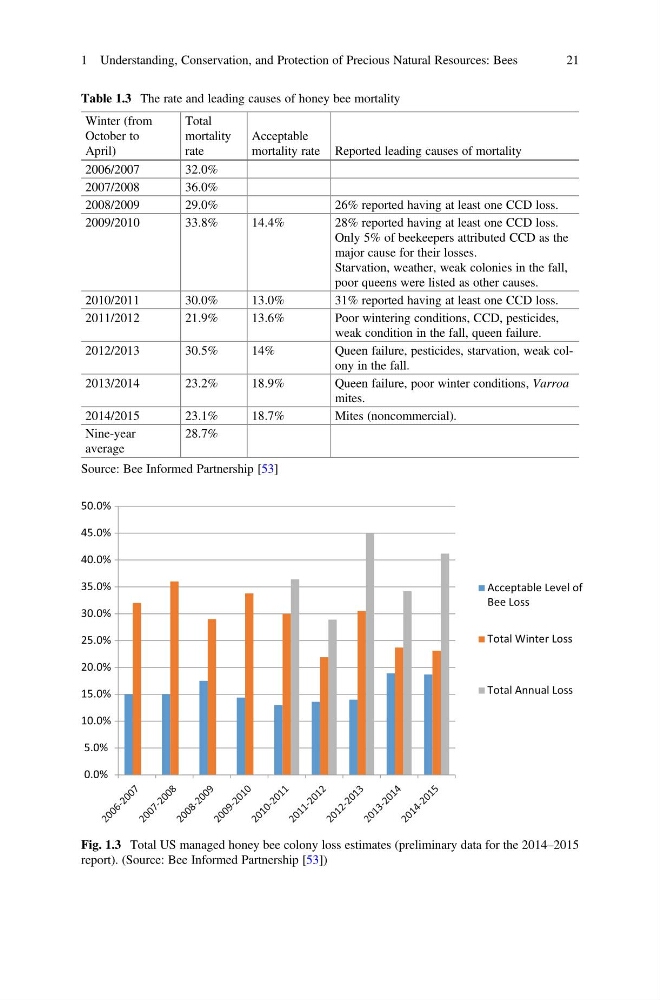
Fig. 1.3 Total US managed honey bee colony loss estimates (preliminary data for the 2014–2015
report). (Source: Bee Informed Partnership [53])
1 Understanding, Conservation, and Protection of Precious Natural Resources: Bees
21
Winter (from
October to
April)
Total
mortality
rate
Acceptable
mortality rate Reported leading causes of mortality
2006/2007
32.0%
2007/2008
36.0%
2008/2009
29.0%
26% reported having at least one CCD loss.
2009/2010
33.8%
14.4%
28% reported having at least one CCD loss.
Only 5% of beekeepers attributed CCD as the
major cause for their losses.
Starvation, weather, weak colonies in the fall,
poor queens were listed as other causes.
2010/2011
30.0%
13.0%
31% reported having at least one CCD loss.
2011/2012
21.9%
13.6%
Poor wintering conditions, CCD, pesticides,
weak condition in the fall, queen failure.
2012/2013
30.5%
14%
Queen failure, pesticides, starvation, weak colony in the fall.
2013/2014
23.2%
18.9%
Queen failure, poor winter conditions, Varroa
mites.
2014/2015
23.1%
18.7%
Mites (noncommercial).
Nine-year
average
28.7%
Source: Bee Informed Partnership [53]
0.0%
5.0%
10.0%
15.0%
20.0%
25.0%
30.0%
35.0%
40.0%
45.0%
50.0%
Acceptable Level of
Bee Loss
Total Winter Loss
Total Annual Loss
Fig. 1.3 Total US managed honey bee colony loss estimates (preliminary data for the 2014–2015
report). (Source: Bee Informed Partnership [53])
1 Understanding, Conservation, and Protection of Precious Natural Resources: Bees
21