

distributors. Low-rate filters commonly have a dosing period of 3 min and a rest
period of 6 min. The underdrains are usually sized to flow half-full at the design flow
rate for adequate ventilation. Head loss through the filter may be 1.52–3.05 m
(5–10 ft), which may be disagreeable if the plant site is too flat to permit gravity
flow. Since the low-rate filter has a greater detention time and lower hydraulic and
organic loadings, it produces a more highly nitrified effluent than the high-rate filter.
The possible drawbacks of low-rate filters are:
(a) Odor problems caused by the septic sewage when weather is warm
(b) The presence of filter flies
(c) The occurrence of filter ponding
For solving the odor problem, the low-rate filters should be located where the
odors would not create a nuisance or where the weather is not warm. When the filter
fly persists as a nuisance, these nuisance organisms can be controlled by flooding,
chlorination, or the use of various pesticides [110, 111]. Ponding of filters occurs
when strong wastes are applied at low hydraulic loading rates. These difficulties are
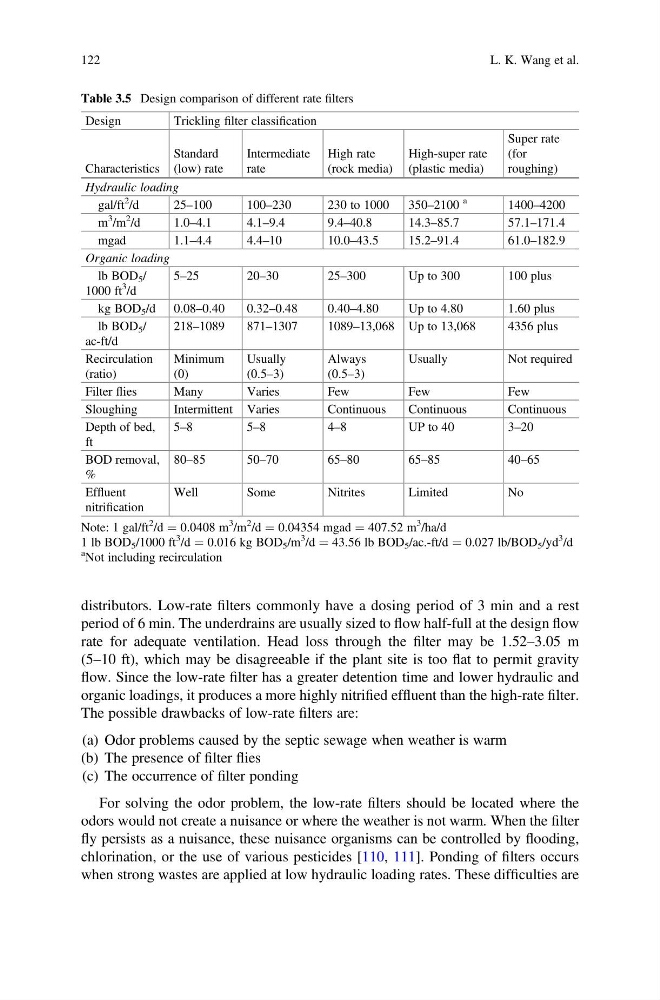
Table 3.5 Design comparison of different rate filters
Design
Trickling filter classification
Characteristics
Standard
(low) rate
Intermediate
rate
High rate
(rock media)
High-super rate
(plastic media)
Super rate
(for
roughing)
Hydraulic loading
gal/ft
2
/d
25–100
100–230
230 to 1000
350–2100
a
1400–4200
m
3
/m
2
/d
1.0–4.1
4.1–9.4
9.4–40.8
14.3–85.7
57.1–171.4
mgad
1.1–4.4
4.4–10
10.0–43.5
15.2–91.4
61.0–182.9
Organic loading
lb BOD 5 /
1000 ft
3
/d
5–25
20–30
25–300
Up to 300
100 plus
kg BOD 5 /d 0.08–0.40
0.32–0.48
0.40–4.80
Up to 4.80
1.60 plus
lb BOD 5 /
ac-ft/d
218–1089
871–1307
1089–13,068 Up to 13,068
4356 plus
Recirculation
(ratio)
Minimum
(0)
Usually
(0.5–3)
Always
(0.5–3)
Usually
Not required
Filter flies
Many
Varies
Few
Few
Few
Sloughing
Intermittent Varies
Continuous
Continuous
Continuous
Depth of bed,
ft
5–8
5 –8
4 –8
U Pt o4 0
3 –20
BOD removal,
%
80–85
50–70
65–80
65–85
40–65
Effluent
nitrification
Well
Some
Nitrites
Limited
No
Note: 1 gal/ft
2
/d ¼ 0.0408 m
3
/m
2
/d ¼ 0.04354 mgad ¼ 407.52 m
3
/ha/d
1 lb BOD 5 /1000 ft
3
/d ¼ 0.016 kg BOD 5 /m
3
/d ¼ 43.56 lb BOD 5 /ac.-ft/d ¼ 0.027 lb/BOD 5 /yd
3
/d
a Not including recirculation
122
L. K. Wang et al.
period of 6 min. The underdrains are usually sized to flow half-full at the design flow
rate for adequate ventilation. Head loss through the filter may be 1.52–3.05 m
(5–10 ft), which may be disagreeable if the plant site is too flat to permit gravity
flow. Since the low-rate filter has a greater detention time and lower hydraulic and
organic loadings, it produces a more highly nitrified effluent than the high-rate filter.
The possible drawbacks of low-rate filters are:
(a) Odor problems caused by the septic sewage when weather is warm
(b) The presence of filter flies
(c) The occurrence of filter ponding
For solving the odor problem, the low-rate filters should be located where the
odors would not create a nuisance or where the weather is not warm. When the filter
fly persists as a nuisance, these nuisance organisms can be controlled by flooding,
chlorination, or the use of various pesticides [110, 111]. Ponding of filters occurs
when strong wastes are applied at low hydraulic loading rates. These difficulties are
Table 3.5 Design comparison of different rate filters
Design
Trickling filter classification
Characteristics
Standard
(low) rate
Intermediate
rate
High rate
(rock media)
High-super rate
(plastic media)
Super rate
(for
roughing)
Hydraulic loading
gal/ft
2
/d
25–100
100–230
230 to 1000
350–2100
a
1400–4200
m
3
/m
2
/d
1.0–4.1
4.1–9.4
9.4–40.8
14.3–85.7
57.1–171.4
mgad
1.1–4.4
4.4–10
10.0–43.5
15.2–91.4
61.0–182.9
Organic loading
lb BOD 5 /
1000 ft
3
/d
5–25
20–30
25–300
Up to 300
100 plus
kg BOD 5 /d 0.08–0.40
0.32–0.48
0.40–4.80
Up to 4.80
1.60 plus
lb BOD 5 /
ac-ft/d
218–1089
871–1307
1089–13,068 Up to 13,068
4356 plus
Recirculation
(ratio)
Minimum
(0)
Usually
(0.5–3)
Always
(0.5–3)
Usually
Not required
Filter flies
Many
Varies
Few
Few
Few
Sloughing
Intermittent Varies
Continuous
Continuous
Continuous
Depth of bed,
ft
5–8
5 –8
4 –8
U Pt o4 0
3 –20
BOD removal,
%
80–85
50–70
65–80
65–85
40–65
Effluent
nitrification
Well
Some
Nitrites
Limited
No
Note: 1 gal/ft
2
/d ¼ 0.0408 m
3
/m
2
/d ¼ 0.04354 mgad ¼ 407.52 m
3
/ha/d
1 lb BOD 5 /1000 ft
3
/d ¼ 0.016 kg BOD 5 /m
3
/d ¼ 43.56 lb BOD 5 /ac.-ft/d ¼ 0.027 lb/BOD 5 /yd
3
/d
a Not including recirculation
122
L. K. Wang et al.