

3 Collective Magnetic Behaviour
77
0.25
0.5
0.75
1
T/T g
0
0.01
0.02
0.03
0.04
0.05
0.06
0.07
0.08
M/M
FC(T
h
)
0
5000
10000
t (s)
0
0.05
0.1
M/M
FC(T
h
)
T h = 110 K
t h = 300 s
T h = 110 K
t w = 0
t h = 300 s
IRM
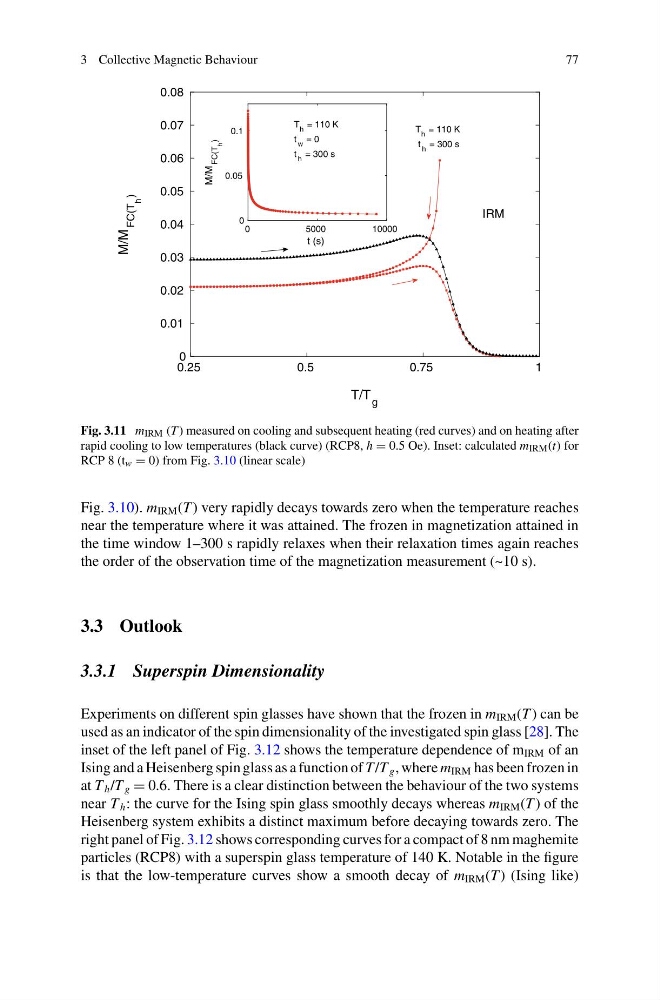
Fig. 3.11 m IRM (T ) measured on cooling and subsequent heating (red curves) and on heating after
rapid cooling to low temperatures (black curve) (RCP8, h = 0.5 Oe). Inset: calculated m IRM (t) for
RCP 8 (t w = 0) from Fig. 3.10 (linear scale)
Fig. 3.10). m IRM (T ) very rapidly decays towards zero when the temperature reaches
near the temperature where it was attained. The frozen in magnetization attained in
the time window 1–300 s rapidly relaxes when their relaxation times again reaches
the order of the observation time of the magnetization measurement (~10 s).
3.3 Outlook
3.3.1 Superspin Dimensionality
Experiments on different spin glasses have shown that the frozen in m IRM (T ) can be
used as an indicator of the spin dimensionality of the investigated spin glass [28]. The
inset of the left panel of Fig. 3.12 shows the temperature dependence of m IRM of an
Ising and a Heisenberg spin glass as a function of T /T g , where m IRM has been frozen in
at T h /T g = 0.6. There is a clear distinction between the behaviour of the two systems
near T h : the curve for the Ising spin glass smoothly decays whereas m IRM (T ) of the
Heisenberg system exhibits a distinct maximum before decaying towards zero. The
right panel of Fig. 3.12 shows corresponding curves for a compact of 8 nm maghemite
particles (RCP8) with a superspin glass temperature of 140 K. Notable in the figure
is that the low-temperature curves show a smooth decay of m IRM (T ) (Ising like)
77
0.25
0.5
0.75
1
T/T g
0
0.01
0.02
0.03
0.04
0.05
0.06
0.07
0.08
M/M
FC(T
h
)
0
5000
10000
t (s)
0
0.05
0.1
M/M
FC(T
h
)
T h = 110 K
t h = 300 s
T h = 110 K
t w = 0
t h = 300 s
IRM
Fig. 3.11 m IRM (T ) measured on cooling and subsequent heating (red curves) and on heating after
rapid cooling to low temperatures (black curve) (RCP8, h = 0.5 Oe). Inset: calculated m IRM (t) for
RCP 8 (t w = 0) from Fig. 3.10 (linear scale)
Fig. 3.10). m IRM (T ) very rapidly decays towards zero when the temperature reaches
near the temperature where it was attained. The frozen in magnetization attained in
the time window 1–300 s rapidly relaxes when their relaxation times again reaches
the order of the observation time of the magnetization measurement (~10 s).
3.3 Outlook
3.3.1 Superspin Dimensionality
Experiments on different spin glasses have shown that the frozen in m IRM (T ) can be
used as an indicator of the spin dimensionality of the investigated spin glass [28]. The
inset of the left panel of Fig. 3.12 shows the temperature dependence of m IRM of an
Ising and a Heisenberg spin glass as a function of T /T g , where m IRM has been frozen in
at T h /T g = 0.6. There is a clear distinction between the behaviour of the two systems
near T h : the curve for the Ising spin glass smoothly decays whereas m IRM (T ) of the
Heisenberg system exhibits a distinct maximum before decaying towards zero. The
right panel of Fig. 3.12 shows corresponding curves for a compact of 8 nm maghemite
particles (RCP8) with a superspin glass temperature of 140 K. Notable in the figure
is that the low-temperature curves show a smooth decay of m IRM (T ) (Ising like)