

292
D. Passeri et al.
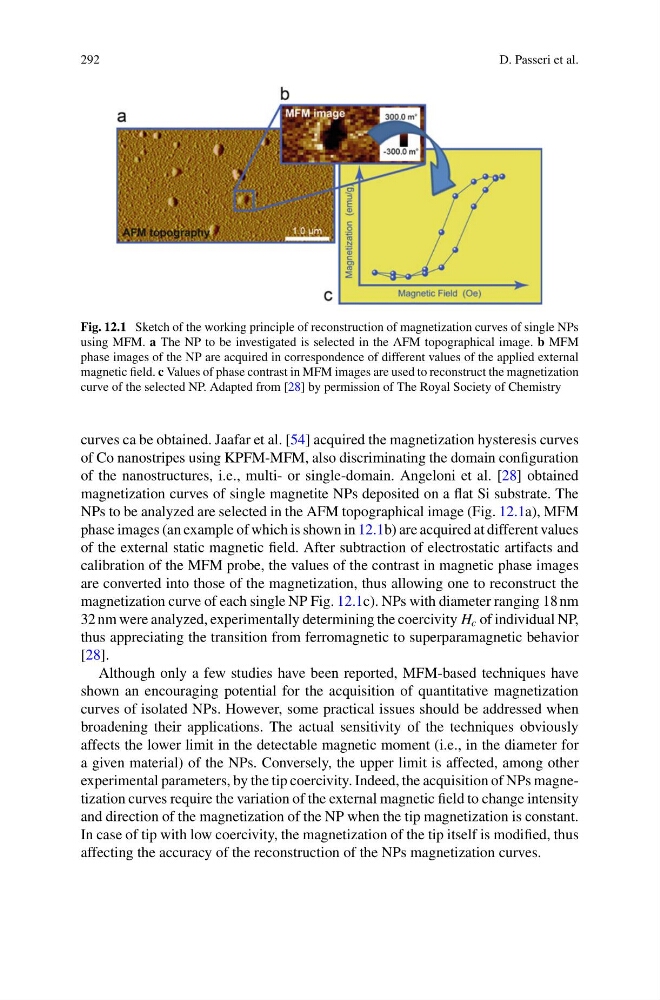
Fig. 12.1 Sketch of the working principle of reconstruction of magnetization curves of single NPs
using MFM. a The NP to be investigated is selected in the AFM topographical image. b MFM
phase images of the NP are acquired in correspondence of different values of the applied external
magnetic field. c Values of phase contrast in MFM images are used to reconstruct the magnetization
curve of the selected NP. Adapted from [28] by permission of The Royal Society of Chemistry
curves ca be obtained. Jaafar et al. [54] acquired the magnetization hysteresis curves
of Co nanostripes using KPFM-MFM, also discriminating the domain configuration
of the nanostructures, i.e., multi- or single-domain. Angeloni et al. [28] obtained
magnetization curves of single magnetite NPs deposited on a flat Si substrate. The
NPs to be analyzed are selected in the AFM topographical image (Fig. 12.1a), MFM
phase images (an example of which is shown in 12.1b) are acquired at different values
of the external static magnetic field. After subtraction of electrostatic artifacts and
calibration of the MFM probe, the values of the contrast in magnetic phase images
are converted into those of the magnetization, thus allowing one to reconstruct the
magnetization curve of each single NP Fig. 12.1c). NPs with diameter ranging 18 nm
32 nm were analyzed, experimentally determining the coercivity H c of individual NP,
thus appreciating the transition from ferromagnetic to superparamagnetic behavior
[28].
Although only a few studies have been reported, MFM-based techniques have
shown an encouraging potential for the acquisition of quantitative magnetization
curves of isolated NPs. However, some practical issues should be addressed when
broadening their applications. The actual sensitivity of the techniques obviously
affects the lower limit in the detectable magnetic moment (i.e., in the diameter for
a given material) of the NPs. Conversely, the upper limit is affected, among other
experimental parameters, by the tip coercivity. Indeed, the acquisition of NPs magnetization curves require the variation of the external magnetic field to change intensity
and direction of the magnetization of the NP when the tip magnetization is constant.
In case of tip with low coercivity, the magnetization of the tip itself is modified, thus
affecting the accuracy of the reconstruction of the NPs magnetization curves.
D. Passeri et al.
Fig. 12.1 Sketch of the working principle of reconstruction of magnetization curves of single NPs
using MFM. a The NP to be investigated is selected in the AFM topographical image. b MFM
phase images of the NP are acquired in correspondence of different values of the applied external
magnetic field. c Values of phase contrast in MFM images are used to reconstruct the magnetization
curve of the selected NP. Adapted from [28] by permission of The Royal Society of Chemistry
curves ca be obtained. Jaafar et al. [54] acquired the magnetization hysteresis curves
of Co nanostripes using KPFM-MFM, also discriminating the domain configuration
of the nanostructures, i.e., multi- or single-domain. Angeloni et al. [28] obtained
magnetization curves of single magnetite NPs deposited on a flat Si substrate. The
NPs to be analyzed are selected in the AFM topographical image (Fig. 12.1a), MFM
phase images (an example of which is shown in 12.1b) are acquired at different values
of the external static magnetic field. After subtraction of electrostatic artifacts and
calibration of the MFM probe, the values of the contrast in magnetic phase images
are converted into those of the magnetization, thus allowing one to reconstruct the
magnetization curve of each single NP Fig. 12.1c). NPs with diameter ranging 18 nm
32 nm were analyzed, experimentally determining the coercivity H c of individual NP,
thus appreciating the transition from ferromagnetic to superparamagnetic behavior
[28].
Although only a few studies have been reported, MFM-based techniques have
shown an encouraging potential for the acquisition of quantitative magnetization
curves of isolated NPs. However, some practical issues should be addressed when
broadening their applications. The actual sensitivity of the techniques obviously
affects the lower limit in the detectable magnetic moment (i.e., in the diameter for
a given material) of the NPs. Conversely, the upper limit is affected, among other
experimental parameters, by the tip coercivity. Indeed, the acquisition of NPs magnetization curves require the variation of the external magnetic field to change intensity
and direction of the magnetization of the NP when the tip magnetization is constant.
In case of tip with low coercivity, the magnetization of the tip itself is modified, thus
affecting the accuracy of the reconstruction of the NPs magnetization curves.