

1.12 Results
47
Zirconium is used as an example here because, for real nuclei, more sophisticated
models reveal that fission barriers peak at a value of ~55 MeV for nuclei with A
~90 (Fig. 1.8). The simulation-computed maximum of ~55.9 MeV for zirconium
is in very good agreement with this value, although that for uranium, ~22 MeV, is
high compared to the true value of ~6 MeV. In the case of uranium, the maximum
distortion energy is reached at about the middle of the fission process, whereas for
zirconium the maximum occurs at near the end of the process. At the moment of
fission, the value of E for uranium has dropped to about −23 MeV.
The numerical precision achieved with this model can be judged by examining
how well it reproduces the configuration energy for the initial undeformed nucleus.
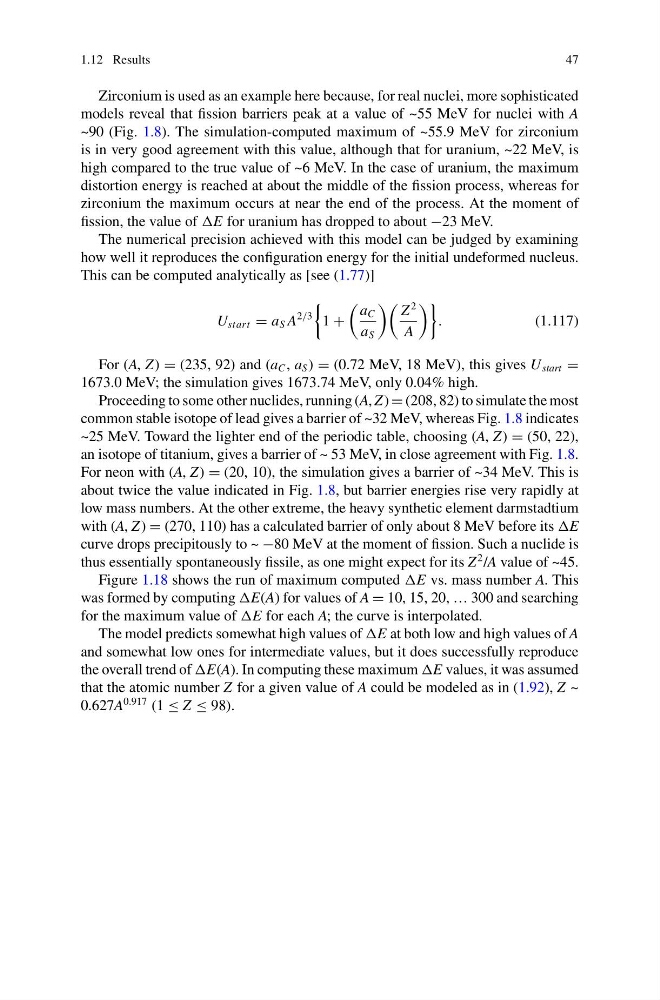
This can be computed analytically as [see (1.77)]
U start = a S A
2/3
1 +
a C
a S
Z
2
A
.
(1.117)
For (A, Z) = (235, 92) and (a C , a S ) = (0.72 MeV, 18 MeV), this gives U start =
1673.0 MeV; the simulation gives 1673.74 MeV, only 0.04% high.
Proceeding to some other nuclides, running (A, Z) = (208, 82) to simulate the most
common stable isotope of lead gives a barrier of ~32 MeV, whereas Fig. 1.8 indicates
~25 MeV. Toward the lighter end of the periodic table, choosing (A, Z) = (50, 22),
an isotope of titanium, gives a barrier of ~ 53 MeV, in close agreement with Fig. 1.8.
For neon with (A, Z) = (20, 10), the simulation gives a barrier of ~34 MeV. This is
about twice the value indicated in Fig. 1.8, but barrier energies rise very rapidly at
low mass numbers. At the other extreme, the heavy synthetic element darmstadtium
with (A, Z) = (270, 110) has a calculated barrier of only about 8 MeV before its E
curve drops precipitously to ~ −80 MeV at the moment of fission. Such a nuclide is
thus essentially spontaneously fissile, as one might expect for its Z
2 /A value of ~45.
Figure 1.18 shows the run of maximum computed E vs. mass number A. This
was formed by computing E(A) for values of A = 10, 15, 20, … 300 and searching
for the maximum value of E for each A; the curve is interpolated.
The model predicts somewhat high values of E at both low and high values of A
and somewhat low ones for intermediate values, but it does successfully reproduce
the overall trend of E(A). In computing these maximum E values, it was assumed
that the atomic number Z for a given value of A could be modeled as in (1.92), Z ~
0.627A
0.917 (1 ≤ Z ≤ 98).
47
Zirconium is used as an example here because, for real nuclei, more sophisticated
models reveal that fission barriers peak at a value of ~55 MeV for nuclei with A
~90 (Fig. 1.8). The simulation-computed maximum of ~55.9 MeV for zirconium
is in very good agreement with this value, although that for uranium, ~22 MeV, is
high compared to the true value of ~6 MeV. In the case of uranium, the maximum
distortion energy is reached at about the middle of the fission process, whereas for
zirconium the maximum occurs at near the end of the process. At the moment of
fission, the value of E for uranium has dropped to about −23 MeV.
The numerical precision achieved with this model can be judged by examining
how well it reproduces the configuration energy for the initial undeformed nucleus.
This can be computed analytically as [see (1.77)]
U start = a S A
2/3
1 +
a C
a S
Z
2
A
.
(1.117)
For (A, Z) = (235, 92) and (a C , a S ) = (0.72 MeV, 18 MeV), this gives U start =
1673.0 MeV; the simulation gives 1673.74 MeV, only 0.04% high.
Proceeding to some other nuclides, running (A, Z) = (208, 82) to simulate the most
common stable isotope of lead gives a barrier of ~32 MeV, whereas Fig. 1.8 indicates
~25 MeV. Toward the lighter end of the periodic table, choosing (A, Z) = (50, 22),
an isotope of titanium, gives a barrier of ~ 53 MeV, in close agreement with Fig. 1.8.
For neon with (A, Z) = (20, 10), the simulation gives a barrier of ~34 MeV. This is
about twice the value indicated in Fig. 1.8, but barrier energies rise very rapidly at
low mass numbers. At the other extreme, the heavy synthetic element darmstadtium
with (A, Z) = (270, 110) has a calculated barrier of only about 8 MeV before its E
curve drops precipitously to ~ −80 MeV at the moment of fission. Such a nuclide is
thus essentially spontaneously fissile, as one might expect for its Z
2 /A value of ~45.
Figure 1.18 shows the run of maximum computed E vs. mass number A. This
was formed by computing E(A) for values of A = 10, 15, 20, … 300 and searching
for the maximum value of E for each A; the curve is interpolated.
The model predicts somewhat high values of E at both low and high values of A
and somewhat low ones for intermediate values, but it does successfully reproduce
the overall trend of E(A). In computing these maximum E values, it was assumed
that the atomic number Z for a given value of A could be modeled as in (1.92), Z ~
0.627A
0.917 (1 ≤ Z ≤ 98).