

5.3 A Model for Trace Isotope Production in a Reactor
187
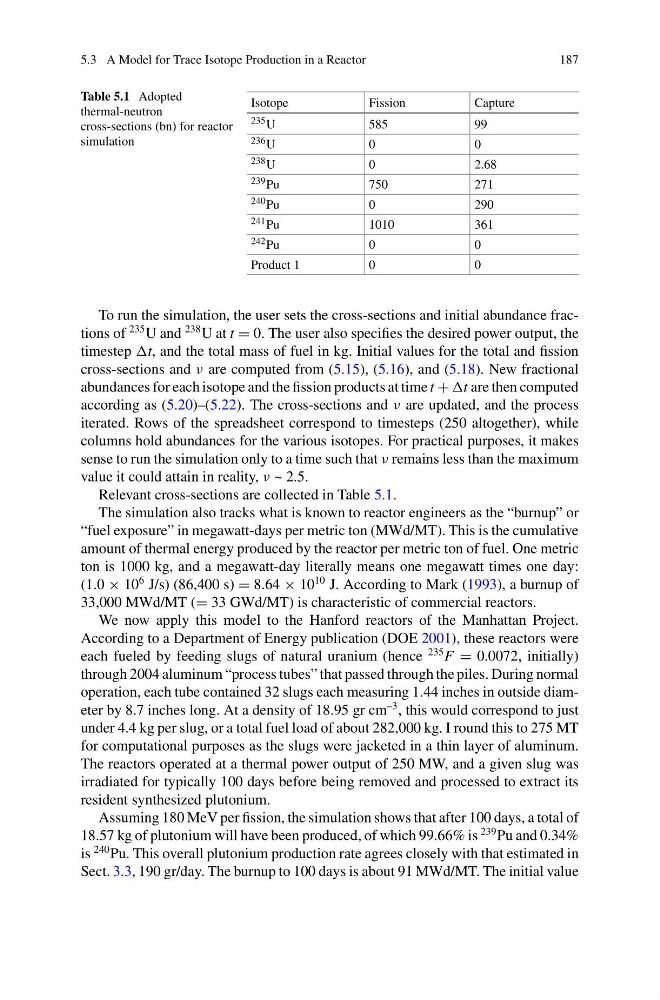
Table 5.1 Adopted
thermal-neutron
cross-sections (bn) for reactor
simulation
Isotope
Fission
Capture
235 U
585
99
236 U
0
0
238 U
0
2.68
239 Pu
750
271
240 Pu
0
290
241 Pu
1010
361
242 Pu
0
0
Product 1
0
0
To run the simulation, the user sets the cross-sections and initial abundance fractions of
235 U and
238 U at t = 0. The user also specifies the desired power output, the
timestep t, and the total mass of fuel in kg. Initial values for the total and fission
cross-sections and ν are computed from (5.15), (5.16), and (5.18). New fractional
abundances for each isotope and the fission products at time t + t are then computed
according as (5.20)–(5.22). The cross-sections and ν are updated, and the process
iterated. Rows of the spreadsheet correspond to timesteps (250 altogether), while
columns hold abundances for the various isotopes. For practical purposes, it makes
sense to run the simulation only to a time such that ν remains less than the maximum
value it could attain in reality, ν ~ 2.5.
Relevant cross-sections are collected in Table 5.1.
The simulation also tracks what is known to reactor engineers as the “burnup” or
“fuel exposure” in megawatt-days per metric ton (MWd/MT). This is the cumulative
amount of thermal energy produced by the reactor per metric ton of fuel. One metric
ton is 1000 kg, and a megawatt-day literally means one megawatt times one day:
(1.0 × 10
6 J/s) (86,400 s) = 8.64 × 10
10 J. According to Mark (1993), a burnup of
33,000 MWd/MT (= 33 GWd/MT) is characteristic of commercial reactors.
We now apply this model to the Hanford reactors of the Manhattan Project.
According to a Department of Energy publication (DOE 2001), these reactors were
each fueled by feeding slugs of natural uranium (hence
235 F = 0.0072, initially)
through 2004 aluminum “process tubes” that passed through the piles. During normal
operation, each tube contained 32 slugs each measuring 1.44 inches in outside diameter by 8.7 inches long. At a density of 18.95 gr cm
–3 , this would correspond to just
under 4.4 kg per slug, or a total fuel load of about 282,000 kg. I round this to 275 MT
for computational purposes as the slugs were jacketed in a thin layer of aluminum.
The reactors operated at a thermal power output of 250 MW, and a given slug was
irradiated for typically 100 days before being removed and processed to extract its
resident synthesized plutonium.
Assuming 180 MeV per fission, the simulation shows that after 100 days, a total of
18.57 kg of plutonium will have been produced, of which 99.66% is
239 Pu and 0.34%
is
240 Pu. This overall plutonium production rate agrees closely with that estimated in
Sect. 3.3, 190 gr/day. The burnup to 100 days is about 91 MWd/MT. The initial value
187
Table 5.1 Adopted
thermal-neutron
cross-sections (bn) for reactor
simulation
Isotope
Fission
Capture
235 U
585
99
236 U
0
0
238 U
0
2.68
239 Pu
750
271
240 Pu
0
290
241 Pu
1010
361
242 Pu
0
0
Product 1
0
0
To run the simulation, the user sets the cross-sections and initial abundance fractions of
235 U and
238 U at t = 0. The user also specifies the desired power output, the
timestep t, and the total mass of fuel in kg. Initial values for the total and fission
cross-sections and ν are computed from (5.15), (5.16), and (5.18). New fractional
abundances for each isotope and the fission products at time t + t are then computed
according as (5.20)–(5.22). The cross-sections and ν are updated, and the process
iterated. Rows of the spreadsheet correspond to timesteps (250 altogether), while
columns hold abundances for the various isotopes. For practical purposes, it makes
sense to run the simulation only to a time such that ν remains less than the maximum
value it could attain in reality, ν ~ 2.5.
Relevant cross-sections are collected in Table 5.1.
The simulation also tracks what is known to reactor engineers as the “burnup” or
“fuel exposure” in megawatt-days per metric ton (MWd/MT). This is the cumulative
amount of thermal energy produced by the reactor per metric ton of fuel. One metric
ton is 1000 kg, and a megawatt-day literally means one megawatt times one day:
(1.0 × 10
6 J/s) (86,400 s) = 8.64 × 10
10 J. According to Mark (1993), a burnup of
33,000 MWd/MT (= 33 GWd/MT) is characteristic of commercial reactors.
We now apply this model to the Hanford reactors of the Manhattan Project.
According to a Department of Energy publication (DOE 2001), these reactors were
each fueled by feeding slugs of natural uranium (hence
235 F = 0.0072, initially)
through 2004 aluminum “process tubes” that passed through the piles. During normal
operation, each tube contained 32 slugs each measuring 1.44 inches in outside diameter by 8.7 inches long. At a density of 18.95 gr cm
–3 , this would correspond to just
under 4.4 kg per slug, or a total fuel load of about 282,000 kg. I round this to 275 MT
for computational purposes as the slugs were jacketed in a thin layer of aluminum.
The reactors operated at a thermal power output of 250 MW, and a given slug was
irradiated for typically 100 days before being removed and processed to extract its
resident synthesized plutonium.
Assuming 180 MeV per fission, the simulation shows that after 100 days, a total of
18.57 kg of plutonium will have been produced, of which 99.66% is
239 Pu and 0.34%
is
240 Pu. This overall plutonium production rate agrees closely with that estimated in
Sect. 3.3, 190 gr/day. The burnup to 100 days is about 91 MWd/MT. The initial value