

142
3 Producing Fissile Material
0
20
40
60
80
100
0
500
1000
1500
2000
2500
% (U-235)
Number of stages
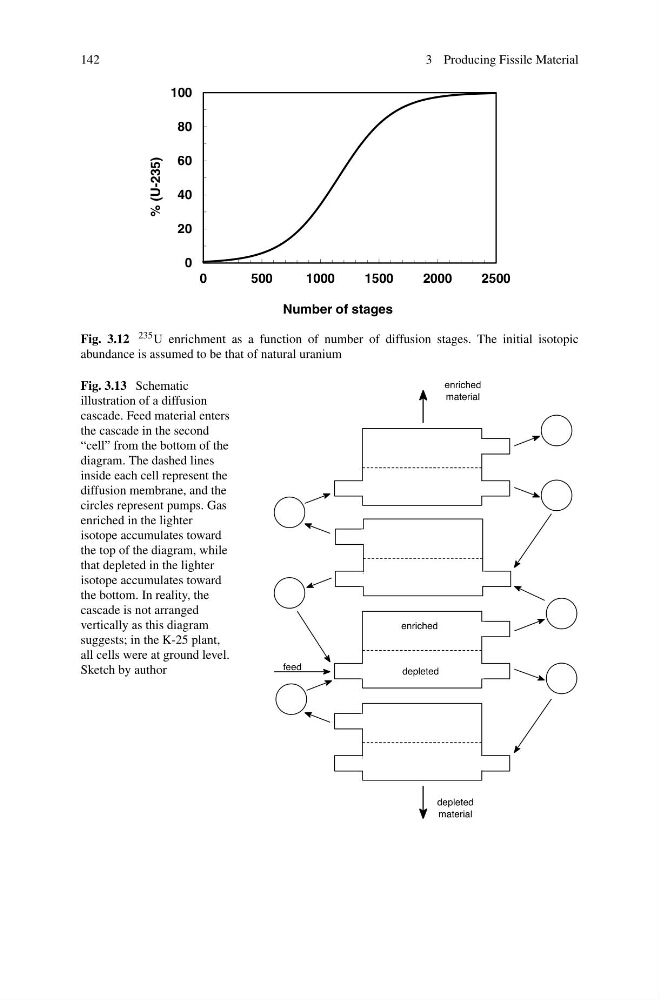
Fig. 3.12 235 U enrichment as a function of number of diffusion stages. The initial isotopic
abundance is assumed to be that of natural uranium
Fig. 3.13 Schematic
illustration of a diffusion
cascade. Feed material enters
the cascade in the second
“cell” from the bottom of the
diagram. The dashed lines
inside each cell represent the
diffusion membrane, and the
circles represent pumps. Gas
enriched in the lighter
isotope accumulates toward
the top of the diagram, while
that depleted in the lighter
isotope accumulates toward
the bottom. In reality, the
cascade is not arranged
vertically as this diagram
suggests; in the K-25 plant,
all cells were at ground level.
Sketch by author
3 Producing Fissile Material
0
20
40
60
80
100
0
500
1000
1500
2000
2500
% (U-235)
Number of stages
Fig. 3.12 235 U enrichment as a function of number of diffusion stages. The initial isotopic
abundance is assumed to be that of natural uranium
Fig. 3.13 Schematic
illustration of a diffusion
cascade. Feed material enters
the cascade in the second
“cell” from the bottom of the
diagram. The dashed lines
inside each cell represent the
diffusion membrane, and the
circles represent pumps. Gas
enriched in the lighter
isotope accumulates toward
the top of the diagram, while
that depleted in the lighter
isotope accumulates toward
the bottom. In reality, the
cascade is not arranged
vertically as this diagram
suggests; in the K-25 plant,
all cells were at ground level.
Sketch by author