

90
2 Critical Mass, Efficiency, and Yield
Serber had in mind using
235 U, for which n ~ 4.794 × 10
28 m
−3 .
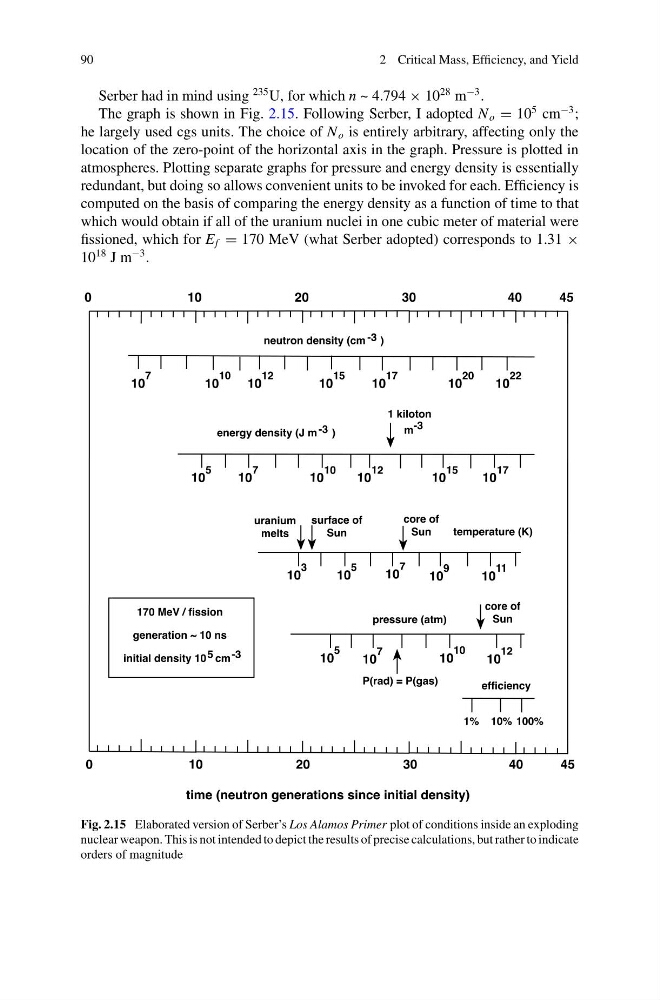
The graph is shown in Fig. 2.15. Following Serber, I adopted N o = 10
5 cm
−3 ;
he largely used cgs units. The choice of N o is entirely arbitrary, affecting only the
location of the zero-point of the horizontal axis in the graph. Pressure is plotted in
atmospheres. Plotting separate graphs for pressure and energy density is essentially
redundant, but doing so allows convenient units to be invoked for each. Efficiency is
computed on the basis of comparing the energy density as a function of time to that
which would obtain if all of the uranium nuclei in one cubic meter of material were
fissioned, which for E f = 170 MeV (what Serber adopted) corresponds to 1.31 ×
10
18 J m
−3 .
Fig. 2.15 Elaborated version of Serber’s Los Alamos Primer plot of conditions inside an exploding
nuclear weapon. This is not intended to depict the results of precise calculations, but rather to indicate
orders of magnitude
2 Critical Mass, Efficiency, and Yield
Serber had in mind using
235 U, for which n ~ 4.794 × 10
28 m
−3 .
The graph is shown in Fig. 2.15. Following Serber, I adopted N o = 10
5 cm
−3 ;
he largely used cgs units. The choice of N o is entirely arbitrary, affecting only the
location of the zero-point of the horizontal axis in the graph. Pressure is plotted in
atmospheres. Plotting separate graphs for pressure and energy density is essentially
redundant, but doing so allows convenient units to be invoked for each. Efficiency is
computed on the basis of comparing the energy density as a function of time to that
which would obtain if all of the uranium nuclei in one cubic meter of material were
fissioned, which for E f = 170 MeV (what Serber adopted) corresponds to 1.31 ×
10
18 J m
−3 .
Fig. 2.15 Elaborated version of Serber’s Los Alamos Primer plot of conditions inside an exploding
nuclear weapon. This is not intended to depict the results of precise calculations, but rather to indicate
orders of magnitude