

246
M. Hiramoto
9.9.5 Doping-Induced Trap Formation
The FET mobility (μ FET ) (Fig. 9.13e, blue curve), which represents the drift mobility,
including the capture and release processes of traps, is one hundred times lower than
the Hall mobility (μ H ), which represents the microscopic mobility free from trapping
processes. Thus, the larger decrease in μ FET than that in μ H upon increasing the
doping concentration is caused by hole traps. The activation energy of traps (E trap )
determined from the temperature dependence of μ FET was 0.18 eV for a 100 ppm
bulk-doped single crystal, which is significantly larger than the activation energy of
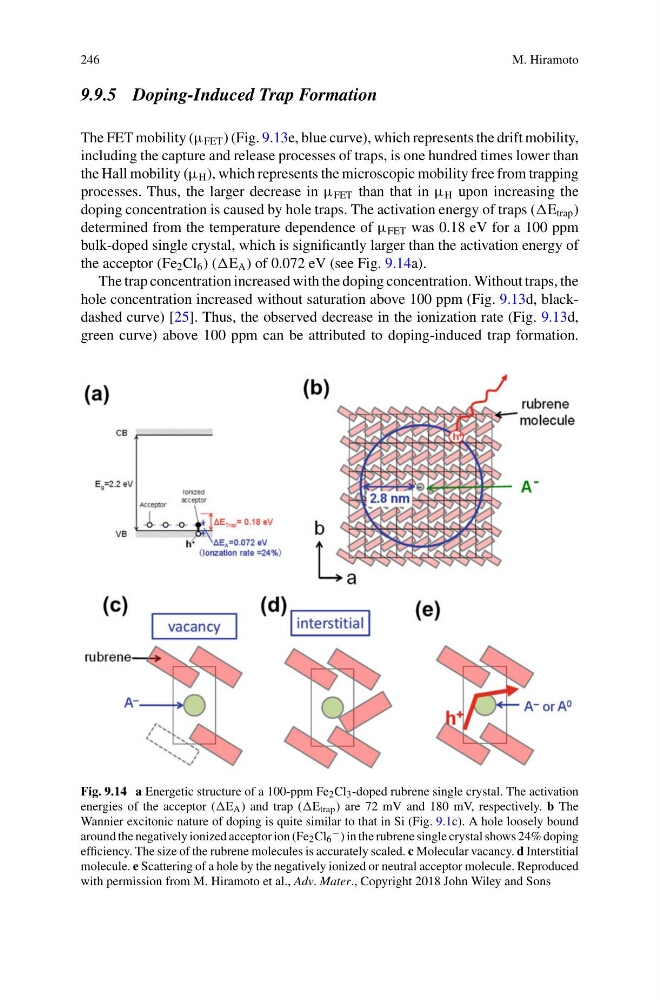
the acceptor (Fe 2 Cl 6 ) (E A ) of 0.072 eV (see Fig. 9.14a).
The trap concentration increased with the doping concentration. Without traps, the
hole concentration increased without saturation above 100 ppm (Fig. 9.13d, blackdashed curve) [25]. Thus, the observed decrease in the ionization rate (Fig. 9.13d,
green curve) above 100 ppm can be attributed to doping-induced trap formation.
Fig. 9.14 a Energetic structure of a 100-ppm Fe 2 Cl 3 -doped rubrene single crystal. The activation
energies of the acceptor (E A ) and trap (E trap ) are 72 mV and 180 mV, respectively. b The
Wannier excitonic nature of doping is quite similar to that in Si (Fig. 9.1c). A hole loosely bound
around the negatively ionized acceptor ion (Fe 2 Cl 6
− ) in the rubrene single crystal shows 24% doping
efficiency. The size of the rubrene molecules is accurately scaled. c Molecular vacancy. d Interstitial
molecule. e Scattering of a hole by the negatively ionized or neutral acceptor molecule. Reproduced
with permission from M. Hiramoto et al., Adv. Mater., Copyright 2018 John Wiley and Sons
M. Hiramoto
9.9.5 Doping-Induced Trap Formation
The FET mobility (μ FET ) (Fig. 9.13e, blue curve), which represents the drift mobility,
including the capture and release processes of traps, is one hundred times lower than
the Hall mobility (μ H ), which represents the microscopic mobility free from trapping
processes. Thus, the larger decrease in μ FET than that in μ H upon increasing the
doping concentration is caused by hole traps. The activation energy of traps (E trap )
determined from the temperature dependence of μ FET was 0.18 eV for a 100 ppm
bulk-doped single crystal, which is significantly larger than the activation energy of
the acceptor (Fe 2 Cl 6 ) (E A ) of 0.072 eV (see Fig. 9.14a).
The trap concentration increased with the doping concentration. Without traps, the
hole concentration increased without saturation above 100 ppm (Fig. 9.13d, blackdashed curve) [25]. Thus, the observed decrease in the ionization rate (Fig. 9.13d,
green curve) above 100 ppm can be attributed to doping-induced trap formation.
Fig. 9.14 a Energetic structure of a 100-ppm Fe 2 Cl 3 -doped rubrene single crystal. The activation
energies of the acceptor (E A ) and trap (E trap ) are 72 mV and 180 mV, respectively. b The
Wannier excitonic nature of doping is quite similar to that in Si (Fig. 9.1c). A hole loosely bound
around the negatively ionized acceptor ion (Fe 2 Cl 6
− ) in the rubrene single crystal shows 24% doping
efficiency. The size of the rubrene molecules is accurately scaled. c Molecular vacancy. d Interstitial
molecule. e Scattering of a hole by the negatively ionized or neutral acceptor molecule. Reproduced
with permission from M. Hiramoto et al., Adv. Mater., Copyright 2018 John Wiley and Sons