

242
M. Hiramoto
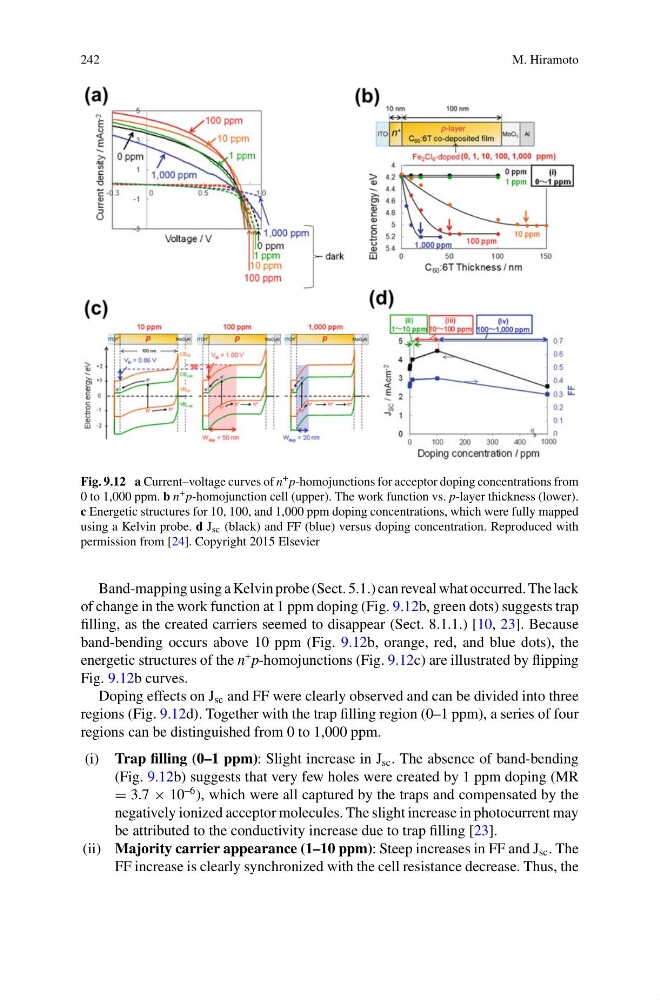
Fig. 9.12 a Current–voltage curves of n + p-homojunctions for acceptor doping concentrations from
0 to 1,000 ppm. b n + p-homojunction cell (upper). The work function vs. p-layer thickness (lower).
c Energetic structures for 10, 100, and 1,000 ppm doping concentrations, which were fully mapped
using a Kelvin probe. d J sc (black) and FF (blue) versus doping concentration. Reproduced with
permission from [24]. Copyright 2015 Elsevier
Band-mapping using a Kelvin probe (Sect. 5.1.) can reveal what occurred. The lack
of change in the work function at 1 ppm doping (Fig. 9.12b, green dots) suggests trap
filling, as the created carriers seemed to disappear (Sect. 8.1.1.) [10, 23]. Because
band-bending occurs above 10 ppm (Fig. 9.12b, orange, red, and blue dots), the
energetic structures of the n
+ p-homojunctions (Fig. 9.12c) are illustrated by flipping
Fig. 9.12b curves.
Doping effects on J sc and FF were clearly observed and can be divided into three
regions (Fig. 9.12d). Together with the trap filling region (0–1 ppm), a series of four
regions can be distinguished from 0 to 1,000 ppm.
(i) Trap filling (0–1 ppm): Slight increase in J sc . The absence of band-bending
(Fig. 9.12b) suggests that very few holes were created by 1 ppm doping (MR
= 3.7 × 10
–6 ), which were all captured by the traps and compensated by the
negatively ionized acceptor molecules. The slight increase in photocurrent may
be attributed to the conductivity increase due to trap filling [23].
(ii) Majority carrier appearance (1–10 ppm): Steep increases in FF and J sc . The
FF increase is clearly synchronized with the cell resistance decrease. Thus, the
M. Hiramoto
Fig. 9.12 a Current–voltage curves of n + p-homojunctions for acceptor doping concentrations from
0 to 1,000 ppm. b n + p-homojunction cell (upper). The work function vs. p-layer thickness (lower).
c Energetic structures for 10, 100, and 1,000 ppm doping concentrations, which were fully mapped
using a Kelvin probe. d J sc (black) and FF (blue) versus doping concentration. Reproduced with
permission from [24]. Copyright 2015 Elsevier
Band-mapping using a Kelvin probe (Sect. 5.1.) can reveal what occurred. The lack
of change in the work function at 1 ppm doping (Fig. 9.12b, green dots) suggests trap
filling, as the created carriers seemed to disappear (Sect. 8.1.1.) [10, 23]. Because
band-bending occurs above 10 ppm (Fig. 9.12b, orange, red, and blue dots), the
energetic structures of the n
+ p-homojunctions (Fig. 9.12c) are illustrated by flipping
Fig. 9.12b curves.
Doping effects on J sc and FF were clearly observed and can be divided into three
regions (Fig. 9.12d). Together with the trap filling region (0–1 ppm), a series of four
regions can be distinguished from 0 to 1,000 ppm.
(i) Trap filling (0–1 ppm): Slight increase in J sc . The absence of band-bending
(Fig. 9.12b) suggests that very few holes were created by 1 ppm doping (MR
= 3.7 × 10
–6 ), which were all captured by the traps and compensated by the
negatively ionized acceptor molecules. The slight increase in photocurrent may
be attributed to the conductivity increase due to trap filling [23].
(ii) Majority carrier appearance (1–10 ppm): Steep increases in FF and J sc . The
FF increase is clearly synchronized with the cell resistance decrease. Thus, the