

9 Parts-Per-Million-Level Doping Effects …
235
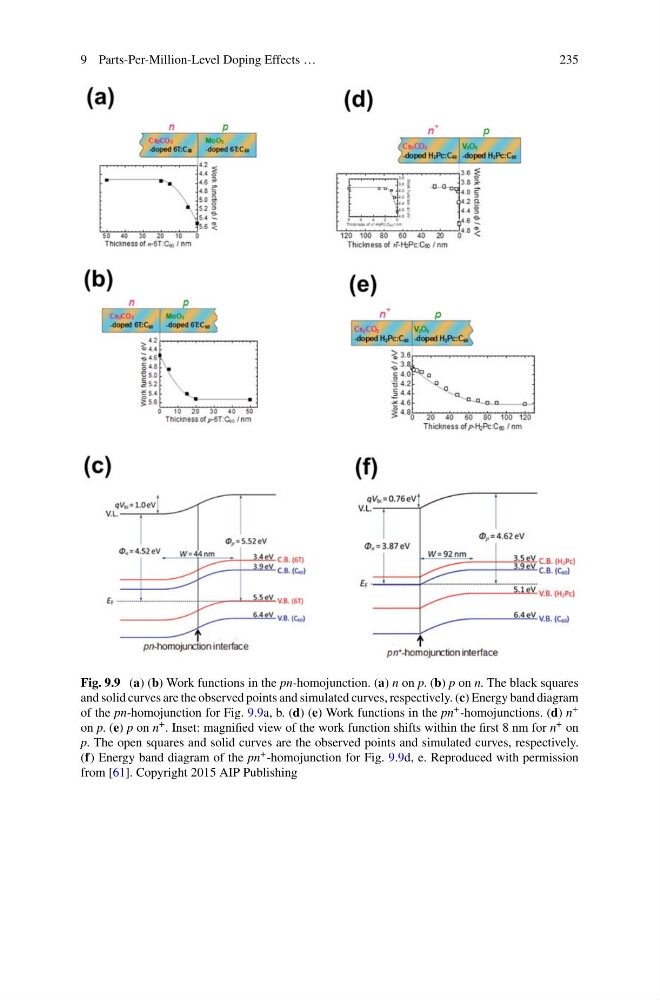
Fig. 9.9 (a) (b) Work functions in the pn-homojunction. (a) n on p. (b) p on n. The black squares
and solid curves are the observed points and simulated curves, respectively. (c) Energy band diagram
of the pn-homojunction for Fig. 9.9a, b. (d) (e) Work functions in the pn + -homojunctions. (d) n +
on p. (e) p on n + . Inset: magnified view of the work function shifts within the first 8 nm for n + on
p. The open squares and solid curves are the observed points and simulated curves, respectively.
(f) Energy band diagram of the pn + -homojunction for Fig. 9.9d, e. Reproduced with permission
from [61]. Copyright 2015 AIP Publishing
235
Fig. 9.9 (a) (b) Work functions in the pn-homojunction. (a) n on p. (b) p on n. The black squares
and solid curves are the observed points and simulated curves, respectively. (c) Energy band diagram
of the pn-homojunction for Fig. 9.9a, b. (d) (e) Work functions in the pn + -homojunctions. (d) n +
on p. (e) p on n + . Inset: magnified view of the work function shifts within the first 8 nm for n + on
p. The open squares and solid curves are the observed points and simulated curves, respectively.
(f) Energy band diagram of the pn + -homojunction for Fig. 9.9d, e. Reproduced with permission
from [61]. Copyright 2015 AIP Publishing