

9 Parts-Per-Million-Level Doping Effects …
233
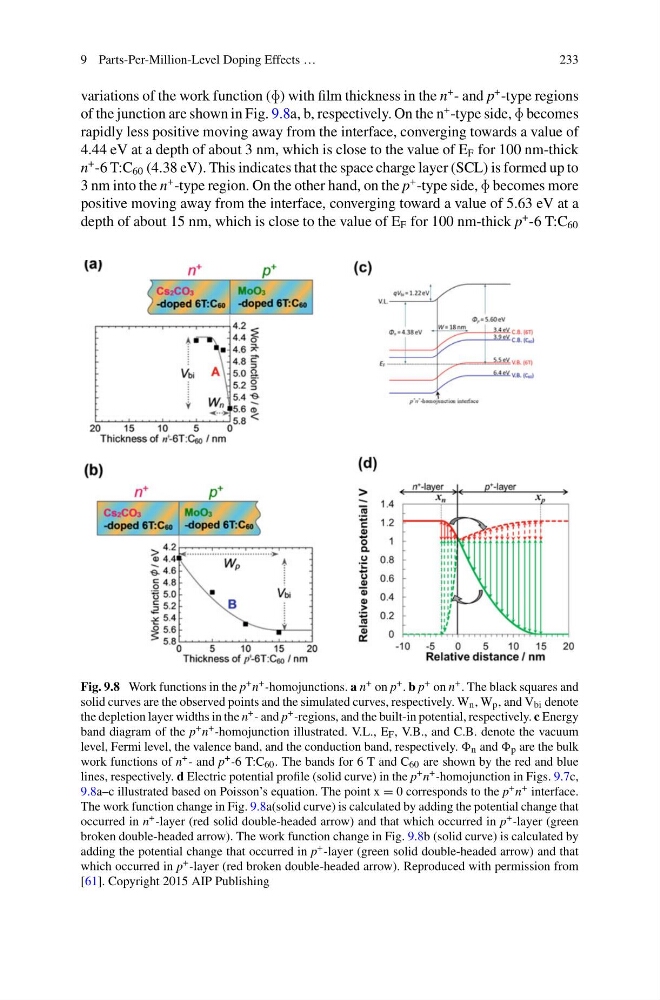
variations of the work function (F) with film thickness in the n
+ - and p
+ -type regions
of the junction are shown in Fig. 9.8a, b, respectively. On the n
+ -type side, F becomes
rapidly less positive moving away from the interface, converging towards a value of
4.44 eV at a depth of about 3 nm, which is close to the value of E F for 100 nm-thick
n
+ -6 T:C 60 (4.38 eV). This indicates that the space charge layer (SCL) is formed up to
3 nm into the n
+ -type region. On the other hand, on the p
+ -type side, F becomes more
positive moving away from the interface, converging toward a value of 5.63 eV at a
depth of about 15 nm, which is close to the value of E F for 100 nm-thick p
+ -6 T:C 60
Fig. 9.8 Work functions in the p + n + -homojunctions. a n + on p + . b p + on n + . The black squares and
solid curves are the observed points and the simulated curves, respectively. W n , W p , and V bi denote
the depletion layer widths in the n + - and p + -regions, and the built-in potential, respectively. c Energy
band diagram of the p + n + -homojunction illustrated. V.L., E F , V.B., and C.B. denote the vacuum
level, Fermi level, the valence band, and the conduction band, respectively. n and p are the bulk
work functions of n + - and p + -6 T:C 60 . The bands for 6 T and C 60 are shown by the red and blue
lines, respectively. d Electric potential profile (solid curve) in the p + n + -homojunction in Figs. 9.7c,
9.8a–c illustrated based on Poisson’s equation. The point x = 0 corresponds to the p + n + interface.
The work function change in Fig. 9.8a(solid curve) is calculated by adding the potential change that
occurred in n + -layer (red solid double-headed arrow) and that which occurred in p + -layer (green
broken double-headed arrow). The work function change in Fig. 9.8b (solid curve) is calculated by
adding the potential change that occurred in p + -layer (green solid double-headed arrow) and that
which occurred in p + -layer (red broken double-headed arrow). Reproduced with permission from
[61]. Copyright 2015 AIP Publishing
233
variations of the work function (F) with film thickness in the n
+ - and p
+ -type regions
of the junction are shown in Fig. 9.8a, b, respectively. On the n
+ -type side, F becomes
rapidly less positive moving away from the interface, converging towards a value of
4.44 eV at a depth of about 3 nm, which is close to the value of E F for 100 nm-thick
n
+ -6 T:C 60 (4.38 eV). This indicates that the space charge layer (SCL) is formed up to
3 nm into the n
+ -type region. On the other hand, on the p
+ -type side, F becomes more
positive moving away from the interface, converging toward a value of 5.63 eV at a
depth of about 15 nm, which is close to the value of E F for 100 nm-thick p
+ -6 T:C 60
Fig. 9.8 Work functions in the p + n + -homojunctions. a n + on p + . b p + on n + . The black squares and
solid curves are the observed points and the simulated curves, respectively. W n , W p , and V bi denote
the depletion layer widths in the n + - and p + -regions, and the built-in potential, respectively. c Energy
band diagram of the p + n + -homojunction illustrated. V.L., E F , V.B., and C.B. denote the vacuum
level, Fermi level, the valence band, and the conduction band, respectively. n and p are the bulk
work functions of n + - and p + -6 T:C 60 . The bands for 6 T and C 60 are shown by the red and blue
lines, respectively. d Electric potential profile (solid curve) in the p + n + -homojunction in Figs. 9.7c,
9.8a–c illustrated based on Poisson’s equation. The point x = 0 corresponds to the p + n + interface.
The work function change in Fig. 9.8a(solid curve) is calculated by adding the potential change that
occurred in n + -layer (red solid double-headed arrow) and that which occurred in p + -layer (green
broken double-headed arrow). The work function change in Fig. 9.8b (solid curve) is calculated by
adding the potential change that occurred in p + -layer (green solid double-headed arrow) and that
which occurred in p + -layer (red broken double-headed arrow). Reproduced with permission from
[61]. Copyright 2015 AIP Publishing