

5 Polymer Solar Cells: Development of π-Conjugated Polymers …
115
consistent with the small L for the PNOz4T/PC 71 BM blend system measured by
cyclic voltammetry.
The solar cells were fabricated using an inverted architecture,
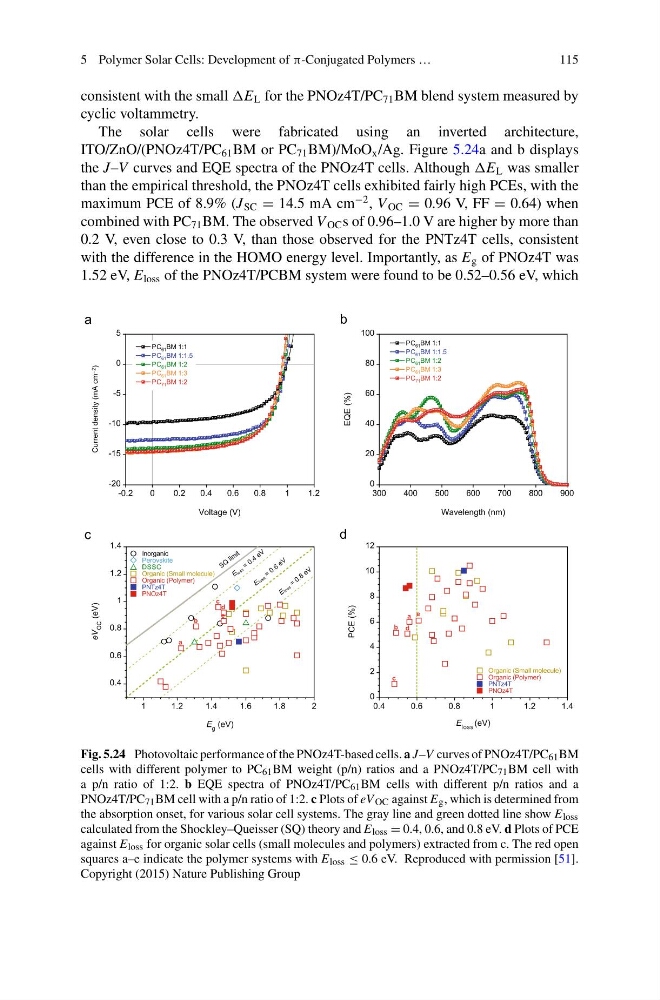
ITO/ZnO/(PNOz4T/PC 61 BM or PC 71 BM)/MoO x /Ag. Figure 5.24a and b displays
the J–V curves and EQE spectra of the PNOz4T cells. Although L was smaller
than the empirical threshold, the PNOz4T cells exhibited fairly high PCEs, with the
maximum PCE of 8.9% (J SC = 14.5 mA cm
−2 , V OC = 0.96 V, FF = 0.64) when
combined with PC 71 BM. The observed V OC s of 0.96–1.0 V are higher by more than
0.2 V, even close to 0.3 V, than those observed for the PNTz4T cells, consistent
with the difference in the HOMO energy level. Importantly, as E g of PNOz4T was
1.52 eV, E loss of the PNOz4T/PCBM system were found to be 0.52–0.56 eV, which
Fig. 5.24 Photovoltaic performance of the PNOz4T-based cells. a J–V curves of PNOz4T/PC 61 BM
cells with different polymer to PC 61 BM weight (p/n) ratios and a PNOz4T/PC 71 BM cell with
a p/n ratio of 1:2. b EQE spectra of PNOz4T/PC 61 BM cells with different p/n ratios and a
PNOz4T/PC 71 BM cell with a p/n ratio of 1:2. c Plots of eV OC against E g , which is determined from
the absorption onset, for various solar cell systems. The gray line and green dotted line show E loss
calculated from the Shockley–Queisser (SQ) theory and E loss = 0.4, 0.6, and 0.8 eV. d Plots of PCE
against E loss for organic solar cells (small molecules and polymers) extracted from c. The red open
squares a–e indicate the polymer systems with E loss ≤ 0.6 eV. Reproduced with permission [51].
Copyright (2015) Nature Publishing Group
115
consistent with the small L for the PNOz4T/PC 71 BM blend system measured by
cyclic voltammetry.
The solar cells were fabricated using an inverted architecture,
ITO/ZnO/(PNOz4T/PC 61 BM or PC 71 BM)/MoO x /Ag. Figure 5.24a and b displays
the J–V curves and EQE spectra of the PNOz4T cells. Although L was smaller
than the empirical threshold, the PNOz4T cells exhibited fairly high PCEs, with the
maximum PCE of 8.9% (J SC = 14.5 mA cm
−2 , V OC = 0.96 V, FF = 0.64) when
combined with PC 71 BM. The observed V OC s of 0.96–1.0 V are higher by more than
0.2 V, even close to 0.3 V, than those observed for the PNTz4T cells, consistent
with the difference in the HOMO energy level. Importantly, as E g of PNOz4T was
1.52 eV, E loss of the PNOz4T/PCBM system were found to be 0.52–0.56 eV, which
Fig. 5.24 Photovoltaic performance of the PNOz4T-based cells. a J–V curves of PNOz4T/PC 61 BM
cells with different polymer to PC 61 BM weight (p/n) ratios and a PNOz4T/PC 71 BM cell with
a p/n ratio of 1:2. b EQE spectra of PNOz4T/PC 61 BM cells with different p/n ratios and a
PNOz4T/PC 71 BM cell with a p/n ratio of 1:2. c Plots of eV OC against E g , which is determined from
the absorption onset, for various solar cell systems. The gray line and green dotted line show E loss
calculated from the Shockley–Queisser (SQ) theory and E loss = 0.4, 0.6, and 0.8 eV. d Plots of PCE
against E loss for organic solar cells (small molecules and polymers) extracted from c. The red open
squares a–e indicate the polymer systems with E loss ≤ 0.6 eV. Reproduced with permission [51].
Copyright (2015) Nature Publishing Group