

202 G. CHEN
341.2, 19%
1106,
62%
35.8, 2%
163.7, 9%
130.3, 8%
hydropower
thermal power
nuclear power
on-grid wind power
on-grid solar
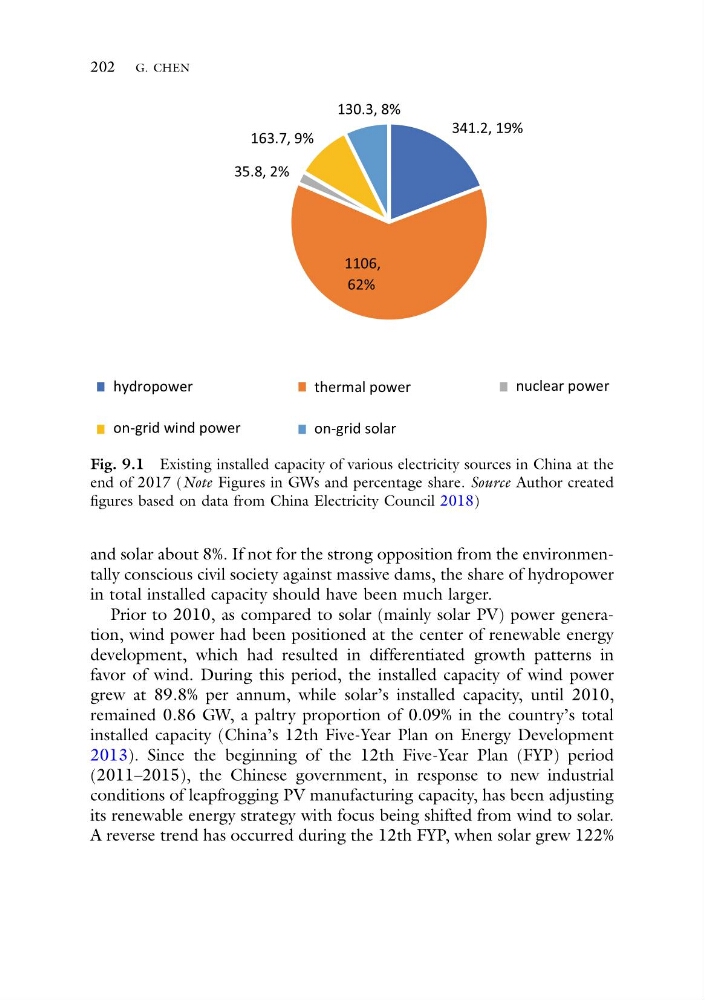
Fig. 9.1 Existing installed capacity of various electricity sources in China at the
end of 2017 (Note Figures in GWs and percentage share. Source Author created
figures based on data from China Electricity Council 2018)
and solar about 8%. If not for the strong opposition from the environmentally conscious civil society against massive dams, the share of hydropower
in total installed capacity should have been much larger.
Prior to 2010, as compared to solar (mainly solar PV) power generation, wind power had been positioned at the center of renewable energy
development, which had resulted in differentiated growth patterns in
favor of wind. During this period, the installed capacity of wind power
grew at 89.8% per annum, while solar’s installed capacity, until 2010,
remained 0.86 GW, a paltry proportion of 0.09% in the country’s total
installed capacity (China’s 12th Five-Year Plan on Energy Development
2013). Since the beginning of the 12th Five-Year Plan (FYP) period
(2011–2015), the Chinese government, in response to new industrial
conditions of leapfrogging PV manufacturing capacity, has been adjusting
its renewable energy strategy with focus being shifted from wind to solar.
A reverse trend has occurred during the 12th FYP, when solar grew 122%
341.2, 19%
1106,
62%
35.8, 2%
163.7, 9%
130.3, 8%
hydropower
thermal power
nuclear power
on-grid wind power
on-grid solar
Fig. 9.1 Existing installed capacity of various electricity sources in China at the
end of 2017 (Note Figures in GWs and percentage share. Source Author created
figures based on data from China Electricity Council 2018)
and solar about 8%. If not for the strong opposition from the environmentally conscious civil society against massive dams, the share of hydropower
in total installed capacity should have been much larger.
Prior to 2010, as compared to solar (mainly solar PV) power generation, wind power had been positioned at the center of renewable energy
development, which had resulted in differentiated growth patterns in
favor of wind. During this period, the installed capacity of wind power
grew at 89.8% per annum, while solar’s installed capacity, until 2010,
remained 0.86 GW, a paltry proportion of 0.09% in the country’s total
installed capacity (China’s 12th Five-Year Plan on Energy Development
2013). Since the beginning of the 12th Five-Year Plan (FYP) period
(2011–2015), the Chinese government, in response to new industrial
conditions of leapfrogging PV manufacturing capacity, has been adjusting
its renewable energy strategy with focus being shifted from wind to solar.
A reverse trend has occurred during the 12th FYP, when solar grew 122%