

Hexagonal Boron Nitride (h-BN) in Solutes Separation
169
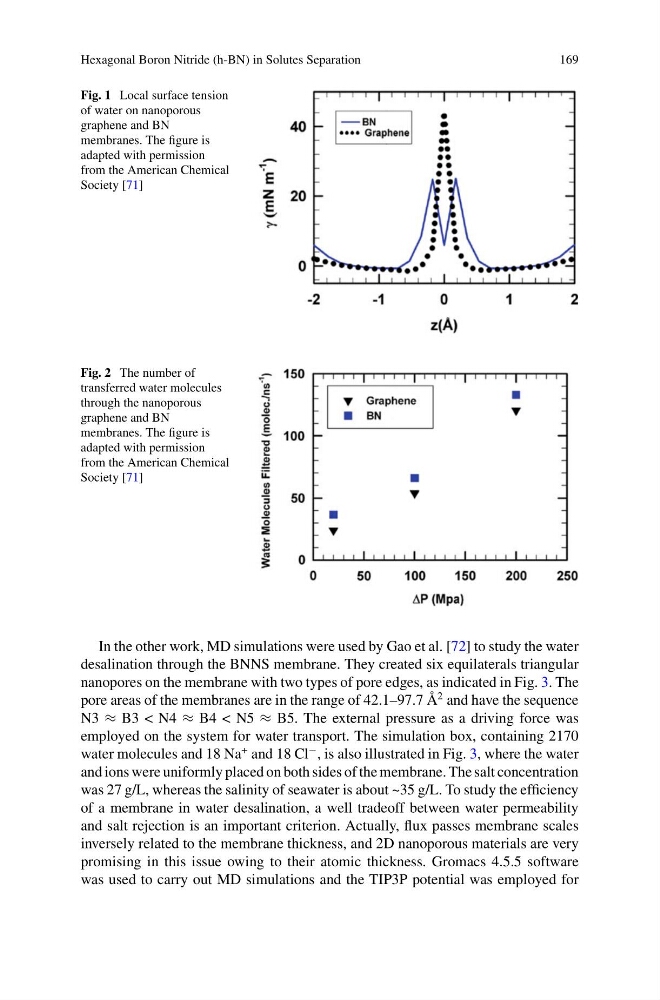
Fig. 1 Local surface tension
of water on nanoporous
graphene and BN
membranes. The figure is
adapted with permission
from the American Chemical
Society [71]
Fig. 2 The number of
transferred water molecules
through the nanoporous
graphene and BN
membranes. The figure is
adapted with permission
from the American Chemical
Society [71]
In the other work, MD simulations were used by Gao et al. [72] to study the water
desalination through the BNNS membrane. They created six equilaterals triangular
nanopores on the membrane with two types of pore edges, as indicated in Fig. 3. The
pore areas of the membranes are in the range of 42.1–97.7 Å
2 and have the sequence
N3 ≈ B3 < N4 ≈ B4 < N5 ≈ B5. The external pressure as a driving force was
employed on the system for water transport. The simulation box, containing 2170
water molecules and 18 Na
+ and 18 Cl
− , is also illustrated in Fig. 3, where the water
and ions were uniformly placed on both sides of the membrane. The salt concentration
was 27 g/L, whereas the salinity of seawater is about ~35 g/L. To study the efficiency
of a membrane in water desalination, a well tradeoff between water permeability
and salt rejection is an important criterion. Actually, flux passes membrane scales
inversely related to the membrane thickness, and 2D nanoporous materials are very
promising in this issue owing to their atomic thickness. Gromacs 4.5.5 software
was used to carry out MD simulations and the TIP3P potential was employed for
169
Fig. 1 Local surface tension
of water on nanoporous
graphene and BN
membranes. The figure is
adapted with permission
from the American Chemical
Society [71]
Fig. 2 The number of
transferred water molecules
through the nanoporous
graphene and BN
membranes. The figure is
adapted with permission
from the American Chemical
Society [71]
In the other work, MD simulations were used by Gao et al. [72] to study the water
desalination through the BNNS membrane. They created six equilaterals triangular
nanopores on the membrane with two types of pore edges, as indicated in Fig. 3. The
pore areas of the membranes are in the range of 42.1–97.7 Å
2 and have the sequence
N3 ≈ B3 < N4 ≈ B4 < N5 ≈ B5. The external pressure as a driving force was
employed on the system for water transport. The simulation box, containing 2170
water molecules and 18 Na
+ and 18 Cl
− , is also illustrated in Fig. 3, where the water
and ions were uniformly placed on both sides of the membrane. The salt concentration
was 27 g/L, whereas the salinity of seawater is about ~35 g/L. To study the efficiency
of a membrane in water desalination, a well tradeoff between water permeability
and salt rejection is an important criterion. Actually, flux passes membrane scales
inversely related to the membrane thickness, and 2D nanoporous materials are very
promising in this issue owing to their atomic thickness. Gromacs 4.5.5 software
was used to carry out MD simulations and the TIP3P potential was employed for