

4 Effective Delayed Neutron Fraction
85
subcritical core. Then, the neutron signals were obtained with the use of an optical
fiber detector [3] at the core center (Figs. A5.3 and A5.4) in Th-HEU-5PE core. The
optical fiber (1 mm diam. and 200 mm long) was coated with a powdered mixture
of
6 LiF (95% enrichment) for detection of thermal neutrons based on
6 Li(n, t)
4 He
reactions and ZnS(Ag) for scintillation.
4.1.2 Numerical Simulations
4.1.2.1 Eigenvalue Calculations
To ensure the accuracy of eigenvalue calculations with the use of MCNPX-2.5.0
[4] and ENDF/B-VII.0 [5], experimental measurements of the excess reactivity and
control rod worth of C1, C2, and C3 were carried out for comparing measured and
calculated reactivities in the reference core. In the experiments, the critical state was
attained by partial insertion of control rod C2 (full withdrawal of C1, C3, S4, S5,
and S6), and excess reactivity was deduced from the coupling with control rod worth
(C2 rod) and its integral calibration curve obtained by the positive period method.
Control rod worth of S4, S5, and S6 was regarded as the same as those of C1, C2,
and C3 obtained by the rod drop method, respectively, because of the symmetrical
configuration of the rods, as shown in Fig. A2.1.
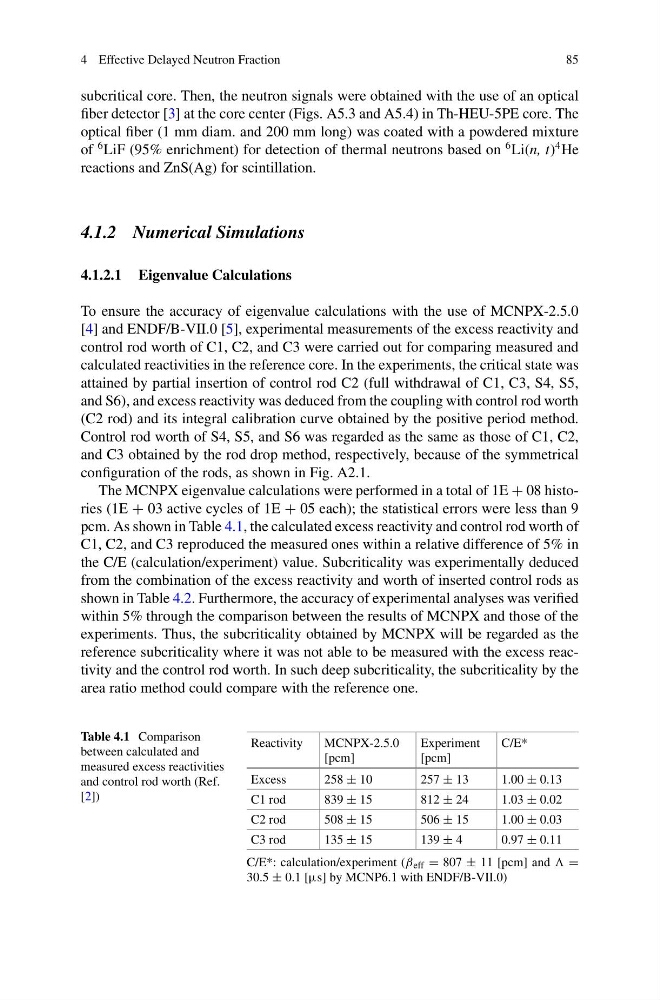
The MCNPX eigenvalue calculations were performed in a total of 1E + 08 histories (1E + 03 active cycles of 1E + 05 each); the statistical errors were less than 9
pcm. As shown in Table 4.1, the calculated excess reactivity and control rod worth of
C1, C2, and C3 reproduced the measured ones within a relative difference of 5% in
the C/E (calculation/experiment) value. Subcriticality was experimentally deduced
from the combination of the excess reactivity and worth of inserted control rods as
shown in Table 4.2. Furthermore, the accuracy of experimental analyses was verified
within 5% through the comparison between the results of MCNPX and those of the
experiments. Thus, the subcriticality obtained by MCNPX will be regarded as the
reference subcriticality where it was not able to be measured with the excess reactivity and the control rod worth. In such deep subcriticality, the subcriticality by the
area ratio method could compare with the reference one.
Table 4.1 Comparison
between calculated and
measured excess reactivities
and control rod worth (Ref.
[2])
Reactivity
MCNPX-2.5.0
[pcm]
Experiment
[pcm]
C/E*
Excess
258 ± 10
257 ± 13
1.00 ± 0.13
C1 rod
839 ± 15
812 ± 24
1.03 ± 0.02
C2 rod
508 ± 15
506 ± 15
1.00 ± 0.03
C3 rod
135 ± 15
139 ± 4
0.97 ± 0.11
C/E*: calculation/experiment (β eff = 807 ± 11 [pcm] and =
30.5 ± 0.1 [μs] by MCNP6.1 with ENDF/B-VII.0)
85
subcritical core. Then, the neutron signals were obtained with the use of an optical
fiber detector [3] at the core center (Figs. A5.3 and A5.4) in Th-HEU-5PE core. The
optical fiber (1 mm diam. and 200 mm long) was coated with a powdered mixture
of
6 LiF (95% enrichment) for detection of thermal neutrons based on
6 Li(n, t)
4 He
reactions and ZnS(Ag) for scintillation.
4.1.2 Numerical Simulations
4.1.2.1 Eigenvalue Calculations
To ensure the accuracy of eigenvalue calculations with the use of MCNPX-2.5.0
[4] and ENDF/B-VII.0 [5], experimental measurements of the excess reactivity and
control rod worth of C1, C2, and C3 were carried out for comparing measured and
calculated reactivities in the reference core. In the experiments, the critical state was
attained by partial insertion of control rod C2 (full withdrawal of C1, C3, S4, S5,
and S6), and excess reactivity was deduced from the coupling with control rod worth
(C2 rod) and its integral calibration curve obtained by the positive period method.
Control rod worth of S4, S5, and S6 was regarded as the same as those of C1, C2,
and C3 obtained by the rod drop method, respectively, because of the symmetrical
configuration of the rods, as shown in Fig. A2.1.
The MCNPX eigenvalue calculations were performed in a total of 1E + 08 histories (1E + 03 active cycles of 1E + 05 each); the statistical errors were less than 9
pcm. As shown in Table 4.1, the calculated excess reactivity and control rod worth of
C1, C2, and C3 reproduced the measured ones within a relative difference of 5% in
the C/E (calculation/experiment) value. Subcriticality was experimentally deduced
from the combination of the excess reactivity and worth of inserted control rods as
shown in Table 4.2. Furthermore, the accuracy of experimental analyses was verified
within 5% through the comparison between the results of MCNPX and those of the
experiments. Thus, the subcriticality obtained by MCNPX will be regarded as the
reference subcriticality where it was not able to be measured with the excess reactivity and the control rod worth. In such deep subcriticality, the subcriticality by the
area ratio method could compare with the reference one.
Table 4.1 Comparison
between calculated and
measured excess reactivities
and control rod worth (Ref.
[2])
Reactivity
MCNPX-2.5.0
[pcm]
Experiment
[pcm]
C/E*
Excess
258 ± 10
257 ± 13
1.00 ± 0.13
C1 rod
839 ± 15
812 ± 24
1.03 ± 0.02
C2 rod
508 ± 15
506 ± 15
1.00 ± 0.03
C3 rod
135 ± 15
139 ± 4
0.97 ± 0.11
C/E*: calculation/experiment (β eff = 807 ± 11 [pcm] and =
30.5 ± 0.1 [μs] by MCNP6.1 with ENDF/B-VII.0)