

60
C. H. Pyeon
Table 3.2 Comparison of measured and calculated subcriticalities (Ref. [2])
Case Experiment (%k/k) JENDL-3.3 (%k/k) C/E ENDF/B-VI.2 (%k/k) C/E
1
0.79 ± 0.06
0.75 ± 0.02
0.95 0.82 ± 0.02
1.04
2
0.68 ± 0.05
0.68 ± 0.02
1.01 0.67 ± 0.02
0.99
3
0.89 ± 0.06
0.98 ± 0.02
1.09 0.91 ± 0.02
1.02
4
0.70 ± 0.05
0.76 ± 0.02
1.09 0.73 ± 0.02
1.04
5
1.76 ± 0.12
1.71 ± 0.02
0.97 1.72 ± 0.02
0.97
Table 3.3 Comparison of measured subcriticalities obtained by the source multiplication method
and calculated subcriticalities by MCNP (Ref. [2])
Case Experiment (%k/k) JENDL-3.3 (%k/k) C/E ENDF/B-VI.2 (%k/k) C/E
11
0.72 ± 0.05
0.69 ± 0.02
0.96
0.69 ± 0.02
0.97
12
2.72 ± 0.19
2.88 ± 0.02
1.06
2.88 ± 0.02
1.06
15
5.96 ± 0.42
6.44 ± 0.02
1.08
6.50 ± 0.02
1.09
18
8.66 ± 0.61
10.46 ± 0.02
1.21 10.54 ± 0.02
1.22
region, respectively. Nonetheless, the results agree with the validation of subcriticality measurement techniques by the rod drop and the positive period methods for
such cores down to about 2 %k/k.
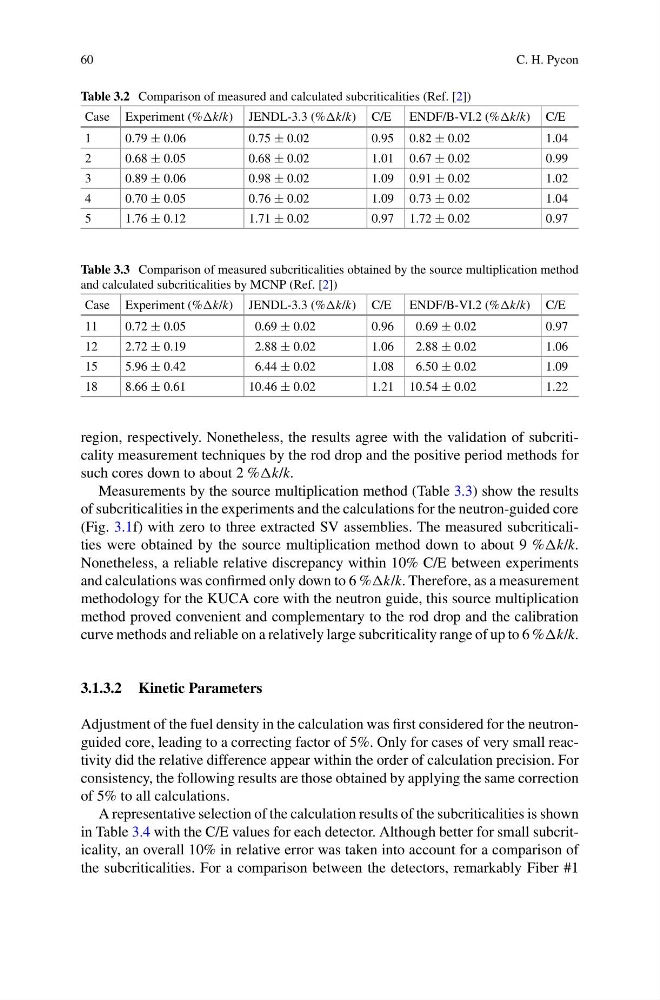
Measurements by the source multiplication method (Table 3.3) show the results
of subcriticalities in the experiments and the calculations for the neutron-guided core
(Fig. 3.1f) with zero to three extracted SV assemblies. The measured subcriticalities were obtained by the source multiplication method down to about 9 %k/k.
Nonetheless, a reliable relative discrepancy within 10% C/E between experiments
and calculations was confirmed only down to 6 %k/k. Therefore, as a measurement
methodology for the KUCA core with the neutron guide, this source multiplication
method proved convenient and complementary to the rod drop and the calibration
curve methods and reliable on a relatively large subcriticality range of up to 6 %k/k.
3.1.3.2 Kinetic Parameters
Adjustment of the fuel density in the calculation was first considered for the neutronguided core, leading to a correcting factor of 5%. Only for cases of very small reactivity did the relative difference appear within the order of calculation precision. For
consistency, the following results are those obtained by applying the same correction
of 5% to all calculations.
A representative selection of the calculation results of the subcriticalities is shown
in Table 3.4 with the C/E values for each detector. Although better for small subcriticality, an overall 10% in relative error was taken into account for a comparison of
the subcriticalities. For a comparison between the detectors, remarkably Fiber #1
C. H. Pyeon
Table 3.2 Comparison of measured and calculated subcriticalities (Ref. [2])
Case Experiment (%k/k) JENDL-3.3 (%k/k) C/E ENDF/B-VI.2 (%k/k) C/E
1
0.79 ± 0.06
0.75 ± 0.02
0.95 0.82 ± 0.02
1.04
2
0.68 ± 0.05
0.68 ± 0.02
1.01 0.67 ± 0.02
0.99
3
0.89 ± 0.06
0.98 ± 0.02
1.09 0.91 ± 0.02
1.02
4
0.70 ± 0.05
0.76 ± 0.02
1.09 0.73 ± 0.02
1.04
5
1.76 ± 0.12
1.71 ± 0.02
0.97 1.72 ± 0.02
0.97
Table 3.3 Comparison of measured subcriticalities obtained by the source multiplication method
and calculated subcriticalities by MCNP (Ref. [2])
Case Experiment (%k/k) JENDL-3.3 (%k/k) C/E ENDF/B-VI.2 (%k/k) C/E
11
0.72 ± 0.05
0.69 ± 0.02
0.96
0.69 ± 0.02
0.97
12
2.72 ± 0.19
2.88 ± 0.02
1.06
2.88 ± 0.02
1.06
15
5.96 ± 0.42
6.44 ± 0.02
1.08
6.50 ± 0.02
1.09
18
8.66 ± 0.61
10.46 ± 0.02
1.21 10.54 ± 0.02
1.22
region, respectively. Nonetheless, the results agree with the validation of subcriticality measurement techniques by the rod drop and the positive period methods for
such cores down to about 2 %k/k.
Measurements by the source multiplication method (Table 3.3) show the results
of subcriticalities in the experiments and the calculations for the neutron-guided core
(Fig. 3.1f) with zero to three extracted SV assemblies. The measured subcriticalities were obtained by the source multiplication method down to about 9 %k/k.
Nonetheless, a reliable relative discrepancy within 10% C/E between experiments
and calculations was confirmed only down to 6 %k/k. Therefore, as a measurement
methodology for the KUCA core with the neutron guide, this source multiplication
method proved convenient and complementary to the rod drop and the calibration
curve methods and reliable on a relatively large subcriticality range of up to 6 %k/k.
3.1.3.2 Kinetic Parameters
Adjustment of the fuel density in the calculation was first considered for the neutronguided core, leading to a correcting factor of 5%. Only for cases of very small reactivity did the relative difference appear within the order of calculation precision. For
consistency, the following results are those obtained by applying the same correction
of 5% to all calculations.
A representative selection of the calculation results of the subcriticalities is shown
in Table 3.4 with the C/E values for each detector. Although better for small subcriticality, an overall 10% in relative error was taken into account for a comparison of
the subcriticalities. For a comparison between the detectors, remarkably Fiber #1