

58
C. H. Pyeon
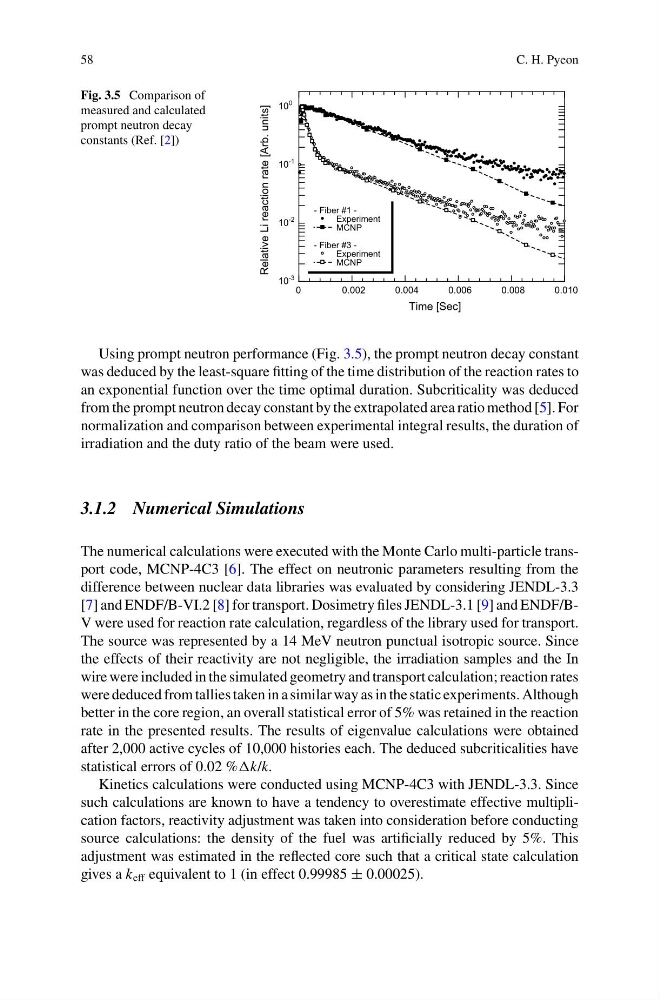
Fig. 3.5 Comparison of
measured and calculated
prompt neutron decay
constants (Ref. [2])
0
0.002
0.004
0.006
0.008
0.010
10
-3
10
-2
10
-1
10
0
Time [Sec]
Relative Li reaction rate [Arb. units]
- Fiber #1 -
Experiment
MCNP
- Fiber #3 -
Experiment
MCNP
Using prompt neutron performance (Fig. 3.5), the prompt neutron decay constant
was deduced by the least-square fitting of the time distribution of the reaction rates to
an exponential function over the time optimal duration. Subcriticality was deduced
from the prompt neutron decay constant by the extrapolated area ratio method [5]. For
normalization and comparison between experimental integral results, the duration of
irradiation and the duty ratio of the beam were used.
3.1.2 Numerical Simulations
The numerical calculations were executed with the Monte Carlo multi-particle transport code, MCNP-4C3 [6]. The effect on neutronic parameters resulting from the
difference between nuclear data libraries was evaluated by considering JENDL-3.3
[7] and ENDF/B-VI.2 [8] for transport. Dosimetry files JENDL-3.1 [9] and ENDF/BV were used for reaction rate calculation, regardless of the library used for transport.
The source was represented by a 14 MeV neutron punctual isotropic source. Since
the effects of their reactivity are not negligible, the irradiation samples and the In
wire were included in the simulated geometry and transport calculation; reaction rates
were deduced from tallies taken in a similar way as in the static experiments. Although
better in the core region, an overall statistical error of 5% was retained in the reaction
rate in the presented results. The results of eigenvalue calculations were obtained
after 2,000 active cycles of 10,000 histories each. The deduced subcriticalities have
statistical errors of 0.02 %
Kinetics calculations were conducted using MCNP-4C3 with JENDL-3.3. Since
such calculations are known to have a tendency to overestimate effective multiplication factors, reactivity adjustment was taken into consideration before conducting
source calculations: the density of the fuel was artificially reduced by 5%. This
adjustment was estimated in the reflected core such that a critical state calculation
gives a k eff equivalent to 1 (in effect 0.99985 ± 0.00025).
C. H. Pyeon
Fig. 3.5 Comparison of
measured and calculated
prompt neutron decay
constants (Ref. [2])
0
0.002
0.004
0.006
0.008
0.010
10
-3
10
-2
10
-1
10
0
Time [Sec]
Relative Li reaction rate [Arb. units]
- Fiber #1 -
Experiment
MCNP
- Fiber #3 -
Experiment
MCNP
Using prompt neutron performance (Fig. 3.5), the prompt neutron decay constant
was deduced by the least-square fitting of the time distribution of the reaction rates to
an exponential function over the time optimal duration. Subcriticality was deduced
from the prompt neutron decay constant by the extrapolated area ratio method [5]. For
normalization and comparison between experimental integral results, the duration of
irradiation and the duty ratio of the beam were used.
3.1.2 Numerical Simulations
The numerical calculations were executed with the Monte Carlo multi-particle transport code, MCNP-4C3 [6]. The effect on neutronic parameters resulting from the
difference between nuclear data libraries was evaluated by considering JENDL-3.3
[7] and ENDF/B-VI.2 [8] for transport. Dosimetry files JENDL-3.1 [9] and ENDF/BV were used for reaction rate calculation, regardless of the library used for transport.
The source was represented by a 14 MeV neutron punctual isotropic source. Since
the effects of their reactivity are not negligible, the irradiation samples and the In
wire were included in the simulated geometry and transport calculation; reaction rates
were deduced from tallies taken in a similar way as in the static experiments. Although
better in the core region, an overall statistical error of 5% was retained in the reaction
rate in the presented results. The results of eigenvalue calculations were obtained
after 2,000 active cycles of 10,000 histories each. The deduced subcriticalities have
statistical errors of 0.02 %
Kinetics calculations were conducted using MCNP-4C3 with JENDL-3.3. Since
such calculations are known to have a tendency to overestimate effective multiplication factors, reactivity adjustment was taken into consideration before conducting
source calculations: the density of the fuel was artificially reduced by 5%. This
adjustment was estimated in the reflected core such that a critical state calculation
gives a k eff equivalent to 1 (in effect 0.99985 ± 0.00025).