

2 Subcriticality
35
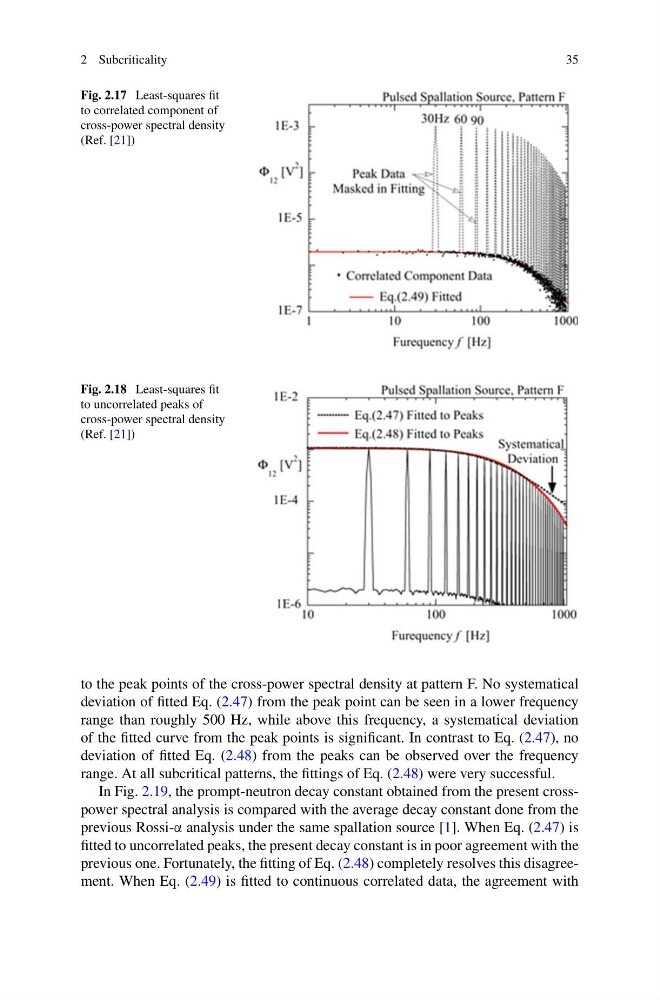
Fig. 2.17 Least-squares fit
to correlated component of
cross-power spectral density
(Ref. [21])
Fig. 2.18 Least-squares fit
to uncorrelated peaks of
cross-power spectral density
(Ref. [21])
to the peak points of the cross-power spectral density at pattern F. No systematical
deviation of fitted Eq. (2.47) from the peak point can be seen in a lower frequency
range than roughly 500 Hz, while above this frequency, a systematical deviation
of the fitted curve from the peak points is significant. In contrast to Eq. (2.47), no
deviation of fitted Eq. (2.48) from the peaks can be observed over the frequency
range. At all subcritical patterns, the fittings of Eq. (2.48) were very successful.
In Fig. 2.19, the prompt-neutron decay constant obtained from the present crosspower spectral analysis is compared with the average decay constant done from the
previous Rossi-α analysis under the same spallation source [1]. When Eq. (2.47) is
fitted to uncorrelated peaks, the present decay constant is in poor agreement with the
previous one. Fortunately, the fitting of Eq. (2.48) completely resolves this disagreement. When Eq. (2.49) is fitted to continuous correlated data, the agreement with
35
Fig. 2.17 Least-squares fit
to correlated component of
cross-power spectral density
(Ref. [21])
Fig. 2.18 Least-squares fit
to uncorrelated peaks of
cross-power spectral density
(Ref. [21])
to the peak points of the cross-power spectral density at pattern F. No systematical
deviation of fitted Eq. (2.47) from the peak point can be seen in a lower frequency
range than roughly 500 Hz, while above this frequency, a systematical deviation
of the fitted curve from the peak points is significant. In contrast to Eq. (2.47), no
deviation of fitted Eq. (2.48) from the peaks can be observed over the frequency
range. At all subcritical patterns, the fittings of Eq. (2.48) were very successful.
In Fig. 2.19, the prompt-neutron decay constant obtained from the present crosspower spectral analysis is compared with the average decay constant done from the
previous Rossi-α analysis under the same spallation source [1]. When Eq. (2.47) is
fitted to uncorrelated peaks, the present decay constant is in poor agreement with the
previous one. Fortunately, the fitting of Eq. (2.48) completely resolves this disagreement. When Eq. (2.49) is fitted to continuous correlated data, the agreement with