

2 Subcriticality
33
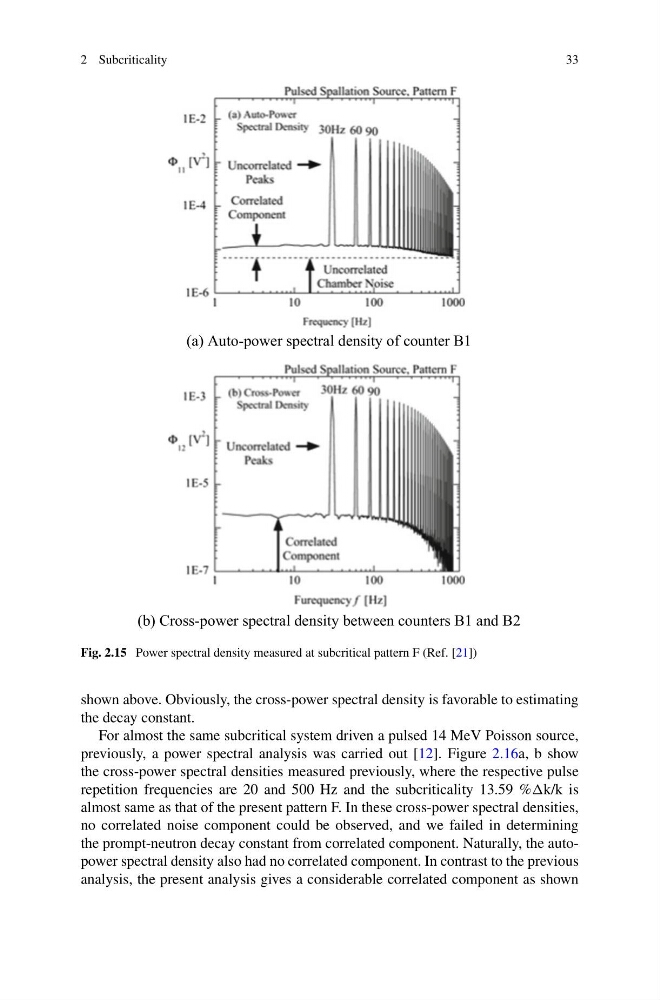
(a) Auto-power spectral density of counter B1
(b) Cross-power spectral density between counters B1 and B2
Fig. 2.15 Power spectral density measured at subcritical pattern F (Ref. [21])
shown above. Obviously, the cross-power spectral density is favorable to estimating
the decay constant.
For almost the same subcritical system driven a pulsed 14 MeV Poisson source,
previously, a power spectral analysis was carried out [12]. Figure 2.16a, b show
the cross-power spectral densities measured previously, where the respective pulse
repetition frequencies are 20 and 500 Hz and the subcriticality 13.59 %k/k is
almost same as that of the present pattern F. In these cross-power spectral densities,
no correlated noise component could be observed, and we failed in determining
the prompt-neutron decay constant from correlated component. Naturally, the autopower spectral density also had no correlated component. In contrast to the previous
analysis, the present analysis gives a considerable correlated component as shown
33
(a) Auto-power spectral density of counter B1
(b) Cross-power spectral density between counters B1 and B2
Fig. 2.15 Power spectral density measured at subcritical pattern F (Ref. [21])
shown above. Obviously, the cross-power spectral density is favorable to estimating
the decay constant.
For almost the same subcritical system driven a pulsed 14 MeV Poisson source,
previously, a power spectral analysis was carried out [12]. Figure 2.16a, b show
the cross-power spectral densities measured previously, where the respective pulse
repetition frequencies are 20 and 500 Hz and the subcriticality 13.59 %k/k is
almost same as that of the present pattern F. In these cross-power spectral densities,
no correlated noise component could be observed, and we failed in determining
the prompt-neutron decay constant from correlated component. Naturally, the autopower spectral density also had no correlated component. In contrast to the previous
analysis, the present analysis gives a considerable correlated component as shown