

274
Appendix A2: 235 U-Fueled and Pb–Bi–Zoned ADS Core
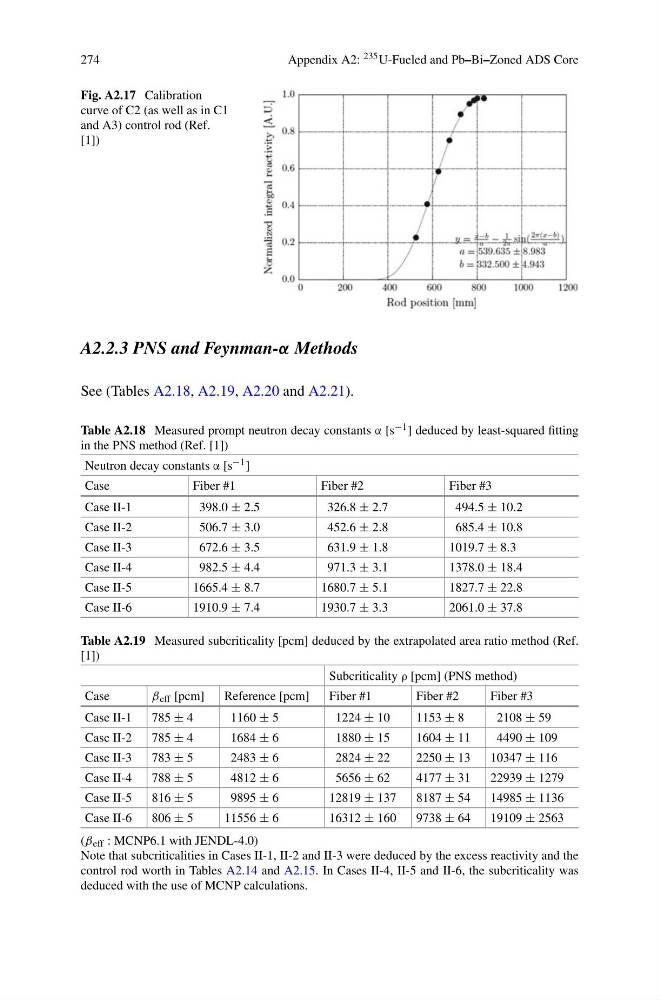
Fig. A2.17 Calibration
curve of C2 (as well as in C1
and A3) control rod (Ref.
[1])
A2.2.3 PNS and Feynman-α Methods
See (Tables A2.18, A2.19, A2.20 and A2.21).
Table A2.18 Measured prompt neutron decay constants α [s −1 ] deduced by least-squared fitting
in the PNS method (Ref. [1])
Neutron decay constants α [s −1 ]
Case
Fiber #1
Fiber #2
Fiber #3
Case II-1
398.0 ± 2.5
326.8 ± 2.7
494.5 ± 10.2
Case II-2
506.7 ± 3.0
452.6 ± 2.8
685.4 ± 10.8
Case II-3
672.6 ± 3.5
631.9 ± 1.8
1019.7 ± 8.3
Case II-4
982.5 ± 4.4
971.3 ± 3.1
1378.0 ± 18.4
Case II-5
1665.4 ± 8.7
1680.7 ± 5.1
1827.7 ± 22.8
Case II-6
1910.9 ± 7.4
1930.7 ± 3.3
2061.0 ± 37.8
Table A2.19 Measured subcriticality [pcm] deduced by the extrapolated area ratio method (Ref.
[1])
Subcriticality ρ [pcm] (PNS method)
Case
β eff [pcm]
Reference [pcm]
Fiber #1
Fiber #2
Fiber #3
Case II-1
785 ± 4
1160 ± 5
1224 ± 10
1153 ± 8
2108 ± 59
Case II-2
785 ± 4
1684 ± 6
1880 ± 15
1604 ± 11
4490 ± 109
Case II-3
783 ± 5
2483 ± 6
2824 ± 22
2250 ± 13
10347 ± 116
Case II-4
788 ± 5
4812 ± 6
5656 ± 62
4177 ± 31
22939 ± 1279
Case II-5
816 ± 5
9895 ± 6
12819 ± 137
8187 ± 54
14985 ± 1136
Case II-6
806 ± 5
11556 ± 6
16312 ± 160
9738 ± 64
19109 ± 2563
(β eff : MCNP6.1 with JENDL-4.0)
Note that subcriticalities in Cases II-1, II-2 and II-3 were deduced by the excess reactivity and the
control rod worth in Tables A2.14 and A2.15. In Cases II-4, II-5 and II-6, the subcriticality was
deduced with the use of MCNP calculations.
Appendix A2: 235 U-Fueled and Pb–Bi–Zoned ADS Core
Fig. A2.17 Calibration
curve of C2 (as well as in C1
and A3) control rod (Ref.
[1])
A2.2.3 PNS and Feynman-α Methods
See (Tables A2.18, A2.19, A2.20 and A2.21).
Table A2.18 Measured prompt neutron decay constants α [s −1 ] deduced by least-squared fitting
in the PNS method (Ref. [1])
Neutron decay constants α [s −1 ]
Case
Fiber #1
Fiber #2
Fiber #3
Case II-1
398.0 ± 2.5
326.8 ± 2.7
494.5 ± 10.2
Case II-2
506.7 ± 3.0
452.6 ± 2.8
685.4 ± 10.8
Case II-3
672.6 ± 3.5
631.9 ± 1.8
1019.7 ± 8.3
Case II-4
982.5 ± 4.4
971.3 ± 3.1
1378.0 ± 18.4
Case II-5
1665.4 ± 8.7
1680.7 ± 5.1
1827.7 ± 22.8
Case II-6
1910.9 ± 7.4
1930.7 ± 3.3
2061.0 ± 37.8
Table A2.19 Measured subcriticality [pcm] deduced by the extrapolated area ratio method (Ref.
[1])
Subcriticality ρ [pcm] (PNS method)
Case
β eff [pcm]
Reference [pcm]
Fiber #1
Fiber #2
Fiber #3
Case II-1
785 ± 4
1160 ± 5
1224 ± 10
1153 ± 8
2108 ± 59
Case II-2
785 ± 4
1684 ± 6
1880 ± 15
1604 ± 11
4490 ± 109
Case II-3
783 ± 5
2483 ± 6
2824 ± 22
2250 ± 13
10347 ± 116
Case II-4
788 ± 5
4812 ± 6
5656 ± 62
4177 ± 31
22939 ± 1279
Case II-5
816 ± 5
9895 ± 6
12819 ± 137
8187 ± 54
14985 ± 1136
Case II-6
806 ± 5
11556 ± 6
16312 ± 160
9738 ± 64
19109 ± 2563
(β eff : MCNP6.1 with JENDL-4.0)
Note that subcriticalities in Cases II-1, II-2 and II-3 were deduced by the excess reactivity and the
control rod worth in Tables A2.14 and A2.15. In Cases II-4, II-5 and II-6, the subcriticality was
deduced with the use of MCNP calculations.