

8 Sensitivity and Uncertainty of Criticality
237
10
-3 10
-2 10
-1 10
0
10
1
10
2
10
3
10
4
10
5
10
6
10
7
-0.075
-0.050
-0.025
0
0.025
0.050
0
20
40
60
80
Neutron energy [eV]
Sensitivity per unit lethargy [-]
EE1 (1/8"P60EUEU)
E3 (3/8"P36EU)
Standard deviation
Standard deviation [%]
Standard deviation
E3
EE1
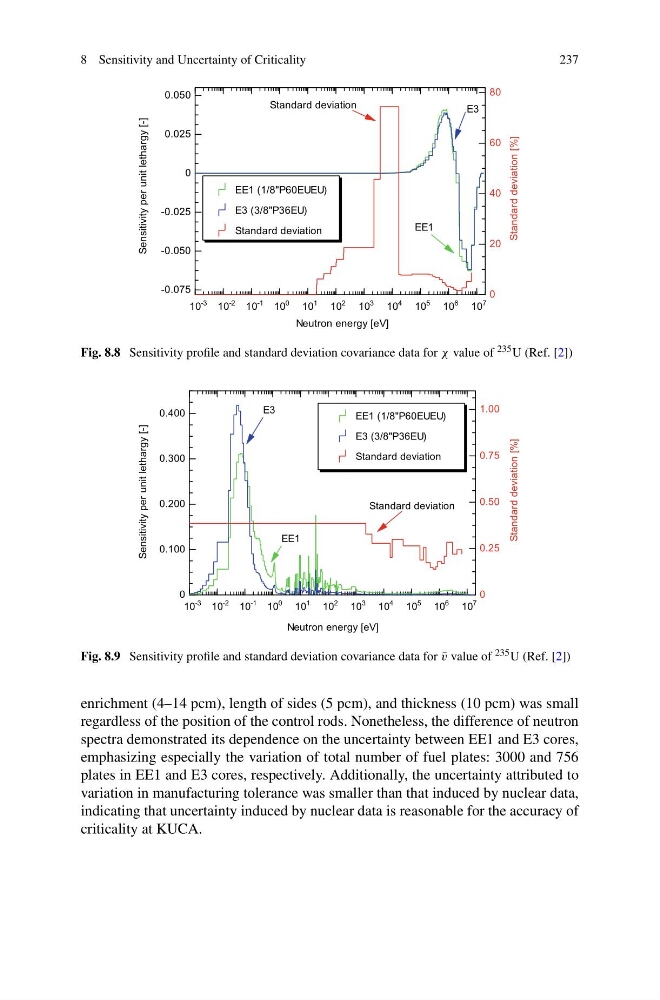
Fig. 8.8 Sensitivity profile and standard deviation covariance data for χ value of 235 U (Ref. [2])
10
-3 10
-2 10
-1 10
0
10
1
10
2
10
3
10
4
10
5
10
6
10
7
0
0.100
0.200
0.300
0.400
0
0.25
0.50
0.75
1.00
Neutron energy [eV]
Sensitivity per unit lethargy [-]
EE1 (1/8"P60EUEU)
E3 (3/8"P36EU)
Standard deviation
Standard deviation [%]
Standard deviation
EE1
E3
Fig. 8.9 Sensitivity profile and standard deviation covariance data for ¯
v value of 235 U (Ref. [2])
enrichment (4–14 pcm), length of sides (5 pcm), and thickness (10 pcm) was small
regardless of the position of the control rods. Nonetheless, the difference of neutron
spectra demonstrated its dependence on the uncertainty between EE1 and E3 cores,
emphasizing especially the variation of total number of fuel plates: 3000 and 756
plates in EE1 and E3 cores, respectively. Additionally, the uncertainty attributed to
variation in manufacturing tolerance was smaller than that induced by nuclear data,
indicating that uncertainty induced by nuclear data is reasonable for the accuracy of
criticality at KUCA.
237
10
-3 10
-2 10
-1 10
0
10
1
10
2
10
3
10
4
10
5
10
6
10
7
-0.075
-0.050
-0.025
0
0.025
0.050
0
20
40
60
80
Neutron energy [eV]
Sensitivity per unit lethargy [-]
EE1 (1/8"P60EUEU)
E3 (3/8"P36EU)
Standard deviation
Standard deviation [%]
Standard deviation
E3
EE1
Fig. 8.8 Sensitivity profile and standard deviation covariance data for χ value of 235 U (Ref. [2])
10
-3 10
-2 10
-1 10
0
10
1
10
2
10
3
10
4
10
5
10
6
10
7
0
0.100
0.200
0.300
0.400
0
0.25
0.50
0.75
1.00
Neutron energy [eV]
Sensitivity per unit lethargy [-]
EE1 (1/8"P60EUEU)
E3 (3/8"P36EU)
Standard deviation
Standard deviation [%]
Standard deviation
EE1
E3
Fig. 8.9 Sensitivity profile and standard deviation covariance data for ¯
v value of 235 U (Ref. [2])
enrichment (4–14 pcm), length of sides (5 pcm), and thickness (10 pcm) was small
regardless of the position of the control rods. Nonetheless, the difference of neutron
spectra demonstrated its dependence on the uncertainty between EE1 and E3 cores,
emphasizing especially the variation of total number of fuel plates: 3000 and 756
plates in EE1 and E3 cores, respectively. Additionally, the uncertainty attributed to
variation in manufacturing tolerance was smaller than that induced by nuclear data,
indicating that uncertainty induced by nuclear data is reasonable for the accuracy of
criticality at KUCA.