

8 Sensitivity and Uncertainty of Criticality
233
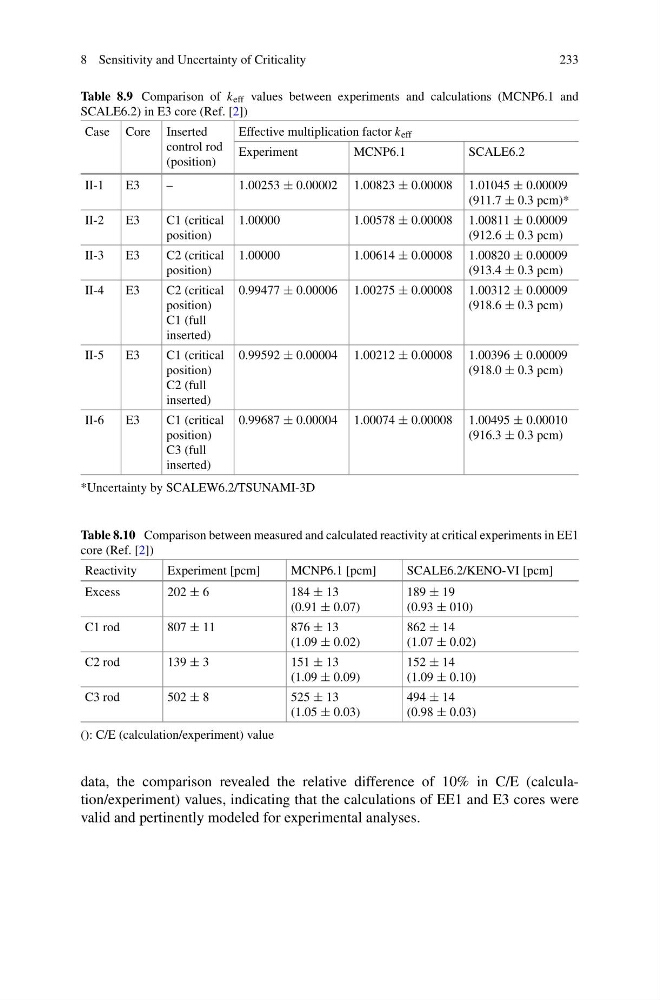
Table 8.9 Comparison of k eff values between experiments and calculations (MCNP6.1 and
SCALE6.2) in E3 core (Ref. [2])
Case Core Inserted
control rod
(position)
Effective multiplication factor k eff
Experiment
MCNP6.1
SCALE6.2
II-1
E3
–
1.00253 ± 0.00002 1.00823 ± 0.00008 1.01045 ± 0.00009
(911.7 ± 0.3 pcm)*
II-2
E3
C1 (critical
position)
1.00000
1.00578 ± 0.00008 1.00811 ± 0.00009
(912.6 ± 0.3 pcm)
II-3
E3
C2 (critical
position)
1.00000
1.00614 ± 0.00008 1.00820 ± 0.00009
(913.4 ± 0.3 pcm)
II-4
E3
C2 (critical
position)
C1 (full
inserted)
0.99477 ± 0.00006 1.00275 ± 0.00008 1.00312 ± 0.00009
(918.6 ± 0.3 pcm)
II-5
E3
C1 (critical
position)
C2 (full
inserted)
0.99592 ± 0.00004 1.00212 ± 0.00008 1.00396 ± 0.00009
(918.0 ± 0.3 pcm)
II-6
E3
C1 (critical
position)
C3 (full
inserted)
0.99687 ± 0.00004 1.00074 ± 0.00008 1.00495 ± 0.00010
(916.3 ± 0.3 pcm)
*Uncertainty by SCALEW6.2/TSUNAMI-3D
Table 8.10 Comparison between measured and calculated reactivity at critical experiments in EE1
core (Ref. [2])
Reactivity
Experiment [pcm]
MCNP6.1 [pcm]
SCALE6.2/KENO-VI [pcm]
Excess
202 ± 6
184 ± 13
(0.91 ± 0.07)
189 ± 19
(0.93 ± 010)
C1 rod
807 ± 11
876 ± 13
(1.09 ± 0.02)
862 ± 14
(1.07 ± 0.02)
C2 rod
139 ± 3
151 ± 13
(1.09 ± 0.09)
152 ± 14
(1.09 ± 0.10)
C3 rod
502 ± 8
525 ± 13
(1.05 ± 0.03)
494 ± 14
(0.98 ± 0.03)
(): C/E (calculation/experiment) value
data, the comparison revealed the relative difference of 10% in C/E (calculation/experiment) values, indicating that the calculations of EE1 and E3 cores were
valid and pertinently modeled for experimental analyses.
233
Table 8.9 Comparison of k eff values between experiments and calculations (MCNP6.1 and
SCALE6.2) in E3 core (Ref. [2])
Case Core Inserted
control rod
(position)
Effective multiplication factor k eff
Experiment
MCNP6.1
SCALE6.2
II-1
E3
–
1.00253 ± 0.00002 1.00823 ± 0.00008 1.01045 ± 0.00009
(911.7 ± 0.3 pcm)*
II-2
E3
C1 (critical
position)
1.00000
1.00578 ± 0.00008 1.00811 ± 0.00009
(912.6 ± 0.3 pcm)
II-3
E3
C2 (critical
position)
1.00000
1.00614 ± 0.00008 1.00820 ± 0.00009
(913.4 ± 0.3 pcm)
II-4
E3
C2 (critical
position)
C1 (full
inserted)
0.99477 ± 0.00006 1.00275 ± 0.00008 1.00312 ± 0.00009
(918.6 ± 0.3 pcm)
II-5
E3
C1 (critical
position)
C2 (full
inserted)
0.99592 ± 0.00004 1.00212 ± 0.00008 1.00396 ± 0.00009
(918.0 ± 0.3 pcm)
II-6
E3
C1 (critical
position)
C3 (full
inserted)
0.99687 ± 0.00004 1.00074 ± 0.00008 1.00495 ± 0.00010
(916.3 ± 0.3 pcm)
*Uncertainty by SCALEW6.2/TSUNAMI-3D
Table 8.10 Comparison between measured and calculated reactivity at critical experiments in EE1
core (Ref. [2])
Reactivity
Experiment [pcm]
MCNP6.1 [pcm]
SCALE6.2/KENO-VI [pcm]
Excess
202 ± 6
184 ± 13
(0.91 ± 0.07)
189 ± 19
(0.93 ± 010)
C1 rod
807 ± 11
876 ± 13
(1.09 ± 0.02)
862 ± 14
(1.07 ± 0.02)
C2 rod
139 ± 3
151 ± 13
(1.09 ± 0.09)
152 ± 14
(1.09 ± 0.10)
C3 rod
502 ± 8
525 ± 13
(1.05 ± 0.03)
494 ± 14
(0.98 ± 0.03)
(): C/E (calculation/experiment) value
data, the comparison revealed the relative difference of 10% in C/E (calculation/experiment) values, indicating that the calculations of EE1 and E3 cores were
valid and pertinently modeled for experimental analyses.