

7 Neutronics of Lead and Bismuth
189
Mention should be made, however, of the accuracy of the numerical analyses
obtained by MCNP with the four libraries, especially the absolute values by JENDL4.0, as shown in Table 7.6. Further investigation was needed to find the reason for
the discrepancy of unit C/E values with JENDL-4.0. Consequently, in addition to the
concept of eigenvalue bias mentioned in Sect. 7.2.2.2, a different evaluation, here
termed “criticality bias,” of sample reactivity worth was introduced to investigate
C/E discrepancy, when the formulation of sample reactivity by MCNP6.1 defined
in Eq. (7.2) is changed to that in Eq. (7.4). As shown in Eq. (7.5), the criticality
bias
MCNP
Critical, Al→Pb by the MCNP approach was obtained by the difference between
reactivity-like criticalities in critical cores by substituting of Al plates for Pb ones, and
interpreted as a bias of reactivity induced by the difference between the experiments
and the eigenvalue calculations. By the introduction of criticality bias in Eq. (7.5), a
small discrepancy in C/E values (Table 7.6) was found in the numerical simulations.
On the basis of Eq. (7.5), criticality bias
MCNP
Critical, Al→Pb was compared with each
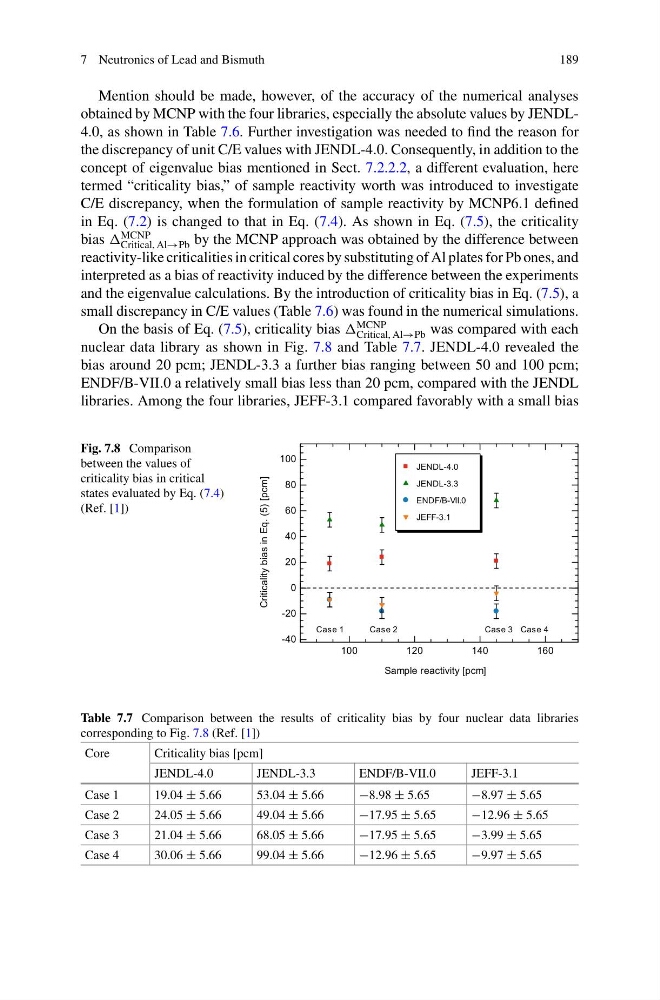
nuclear data library as shown in Fig. 7.8 and Table 7.7. JENDL-4.0 revealed the
bias around 20 pcm; JENDL-3.3 a further bias ranging between 50 and 100 pcm;
ENDF/B-VII.0 a relatively small bias less than 20 pcm, compared with the JENDL
libraries. Among the four libraries, JEFF-3.1 compared favorably with a small bias
Fig. 7.8 Comparison
between the values of
criticality bias in critical
states evaluated by Eq. (7.4)
(Ref. [1])
100
120
140
160
-40
-20
0
20
40
60
80
100
Sample reactivity [pcm]
Criticality bias in Eq. (5) [pcm]
Case 1
Case 2
Case 3 Case 4
JENDL-4.0
JENDL-3.3
ENDF/B-VII.0
JEFF-3.1
Table 7.7 Comparison between the results of criticality bias by four nuclear data libraries
corresponding to Fig. 7.8 (Ref. [1])
Core
Criticality bias [pcm]
JENDL-4.0
JENDL-3.3
ENDF/B-VII.0
JEFF-3.1
Case 1
19.04 ± 5.66
53.04 ± 5.66
−8.98 ± 5.65
−8.97 ± 5.65
Case 2
24.05 ± 5.66
49.04 ± 5.66
−17.95 ± 5.65
−12.96 ± 5.65
Case 3
21.04 ± 5.66
68.05 ± 5.66
−17.95 ± 5.65
−3.99 ± 5.65
Case 4
30.06 ± 5.66
99.04 ± 5.66
−12.96 ± 5.65
−9.97 ± 5.65
189
Mention should be made, however, of the accuracy of the numerical analyses
obtained by MCNP with the four libraries, especially the absolute values by JENDL4.0, as shown in Table 7.6. Further investigation was needed to find the reason for
the discrepancy of unit C/E values with JENDL-4.0. Consequently, in addition to the
concept of eigenvalue bias mentioned in Sect. 7.2.2.2, a different evaluation, here
termed “criticality bias,” of sample reactivity worth was introduced to investigate
C/E discrepancy, when the formulation of sample reactivity by MCNP6.1 defined
in Eq. (7.2) is changed to that in Eq. (7.4). As shown in Eq. (7.5), the criticality
bias
MCNP
Critical, Al→Pb by the MCNP approach was obtained by the difference between
reactivity-like criticalities in critical cores by substituting of Al plates for Pb ones, and
interpreted as a bias of reactivity induced by the difference between the experiments
and the eigenvalue calculations. By the introduction of criticality bias in Eq. (7.5), a
small discrepancy in C/E values (Table 7.6) was found in the numerical simulations.
On the basis of Eq. (7.5), criticality bias
MCNP
Critical, Al→Pb was compared with each
nuclear data library as shown in Fig. 7.8 and Table 7.7. JENDL-4.0 revealed the
bias around 20 pcm; JENDL-3.3 a further bias ranging between 50 and 100 pcm;
ENDF/B-VII.0 a relatively small bias less than 20 pcm, compared with the JENDL
libraries. Among the four libraries, JEFF-3.1 compared favorably with a small bias
Fig. 7.8 Comparison
between the values of
criticality bias in critical
states evaluated by Eq. (7.4)
(Ref. [1])
100
120
140
160
-40
-20
0
20
40
60
80
100
Sample reactivity [pcm]
Criticality bias in Eq. (5) [pcm]
Case 1
Case 2
Case 3 Case 4
JENDL-4.0
JENDL-3.3
ENDF/B-VII.0
JEFF-3.1
Table 7.7 Comparison between the results of criticality bias by four nuclear data libraries
corresponding to Fig. 7.8 (Ref. [1])
Core
Criticality bias [pcm]
JENDL-4.0
JENDL-3.3
ENDF/B-VII.0
JEFF-3.1
Case 1
19.04 ± 5.66
53.04 ± 5.66
−8.98 ± 5.65
−8.97 ± 5.65
Case 2
24.05 ± 5.66
49.04 ± 5.66
−17.95 ± 5.65
−12.96 ± 5.65
Case 3
21.04 ± 5.66
68.05 ± 5.66
−17.95 ± 5.65
−3.99 ± 5.65
Case 4
30.06 ± 5.66
99.04 ± 5.66
−12.96 ± 5.65
−9.97 ± 5.65