

170
C. H. Pyeon
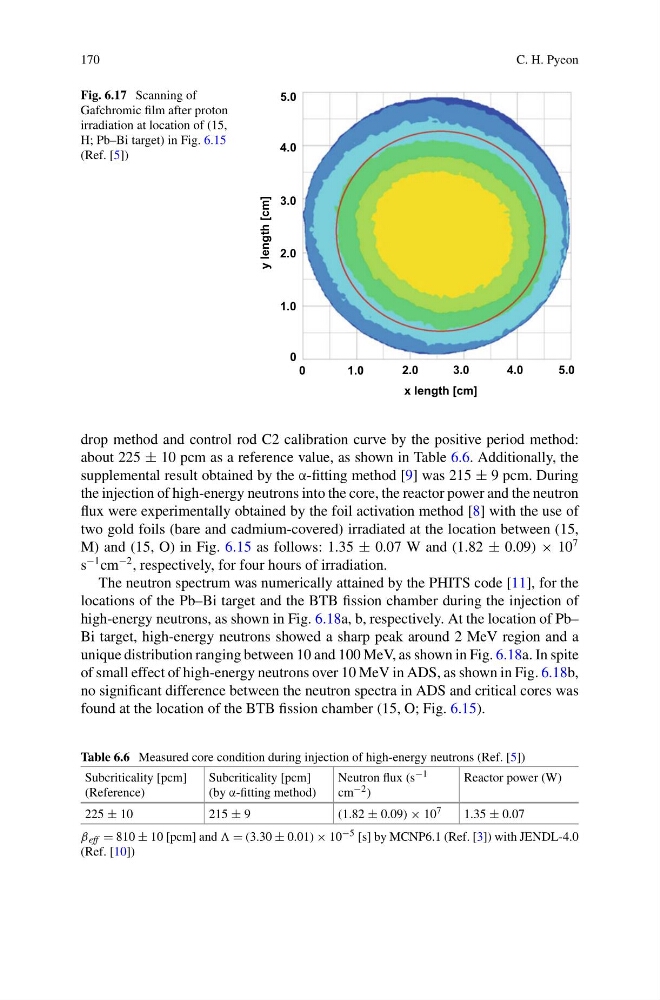
Fig. 6.17 Scanning of
Gafchromic film after proton
irradiation at location of (15,
H; Pb–Bi target) in Fig. 6.15
(Ref. [5])
x length [cm]
0
1 . 0
2.0
3.0
4.0
5.0
y length [cm]
0
1.0
2.0
3.0
4.0
5.0
drop method and control rod C2 calibration curve by the positive period method:
about 225 ± 10 pcm as a reference value, as shown in Table 6.6. Additionally, the
supplemental result obtained by the α-fitting method [9] was 215 ± 9 pcm. During
the injection of high-energy neutrons into the core, the reactor power and the neutron
flux were experimentally obtained by the foil activation method [8] with the use of
two gold foils (bare and cadmium-covered) irradiated at the location between (15,
M) and (15, O) in Fig. 6.15 as follows: 1.35 ± 0.07 W and (1.82 ± 0.09) × 10
7
s
−1 cm
−2 , respectively, for four hours of irradiation.
The neutron spectrum was numerically attained by the PHITS code [11], for the
locations of the Pb–Bi target and the BTB fission chamber during the injection of
high-energy neutrons, as shown in Fig. 6.18a, b, respectively. At the location of Pb–
Bi target, high-energy neutrons showed a sharp peak around 2 MeV region and a
unique distribution ranging between 10 and 100 MeV, as shown in Fig. 6.18a. In spite
of small effect of high-energy neutrons over 10 MeV in ADS, as shown in Fig. 6.18b,
no significant difference between the neutron spectra in ADS and critical cores was
found at the location of the BTB fission chamber (15, O; Fig. 6.15).
Table 6.6 Measured core condition during injection of high-energy neutrons (Ref. [5])
Subcriticality [pcm]
(Reference)
Subcriticality [pcm]
(by α-fitting method)
Neutron flux (s −1
cm −2 )
Reactor power (W)
225 ± 10
215 ± 9
(1.82 ± 0.09) × 10 7
1.35 ± 0.07
β eff = 810 ± 10 [pcm] and = (3.30 ± 0.01) × 10 −5 [s] by MCNP6.1 (Ref. [3]) with JENDL-4.0
(Ref. [10])
C. H. Pyeon
Fig. 6.17 Scanning of
Gafchromic film after proton
irradiation at location of (15,
H; Pb–Bi target) in Fig. 6.15
(Ref. [5])
x length [cm]
0
1 . 0
2.0
3.0
4.0
5.0
y length [cm]
0
1.0
2.0
3.0
4.0
5.0
drop method and control rod C2 calibration curve by the positive period method:
about 225 ± 10 pcm as a reference value, as shown in Table 6.6. Additionally, the
supplemental result obtained by the α-fitting method [9] was 215 ± 9 pcm. During
the injection of high-energy neutrons into the core, the reactor power and the neutron
flux were experimentally obtained by the foil activation method [8] with the use of
two gold foils (bare and cadmium-covered) irradiated at the location between (15,
M) and (15, O) in Fig. 6.15 as follows: 1.35 ± 0.07 W and (1.82 ± 0.09) × 10
7
s
−1 cm
−2 , respectively, for four hours of irradiation.
The neutron spectrum was numerically attained by the PHITS code [11], for the
locations of the Pb–Bi target and the BTB fission chamber during the injection of
high-energy neutrons, as shown in Fig. 6.18a, b, respectively. At the location of Pb–
Bi target, high-energy neutrons showed a sharp peak around 2 MeV region and a
unique distribution ranging between 10 and 100 MeV, as shown in Fig. 6.18a. In spite
of small effect of high-energy neutrons over 10 MeV in ADS, as shown in Fig. 6.18b,
no significant difference between the neutron spectra in ADS and critical cores was
found at the location of the BTB fission chamber (15, O; Fig. 6.15).
Table 6.6 Measured core condition during injection of high-energy neutrons (Ref. [5])
Subcriticality [pcm]
(Reference)
Subcriticality [pcm]
(by α-fitting method)
Neutron flux (s −1
cm −2 )
Reactor power (W)
225 ± 10
215 ± 9
(1.82 ± 0.09) × 10 7
1.35 ± 0.07
β eff = 810 ± 10 [pcm] and = (3.30 ± 0.01) × 10 −5 [s] by MCNP6.1 (Ref. [3]) with JENDL-4.0
(Ref. [10])