

6 Nuclear Transmutation of Minor Actinide
165
6.1.2.2 Numerical Analyses
Numerical analyses were carried out with the use of MCNP6.1 [2] together
with ENDF/B-VII.1 [3]; analyses of
197 Au capture reaction rates were done with
JENDL/D-99 [4]. The comparison between measured and calculated results, as
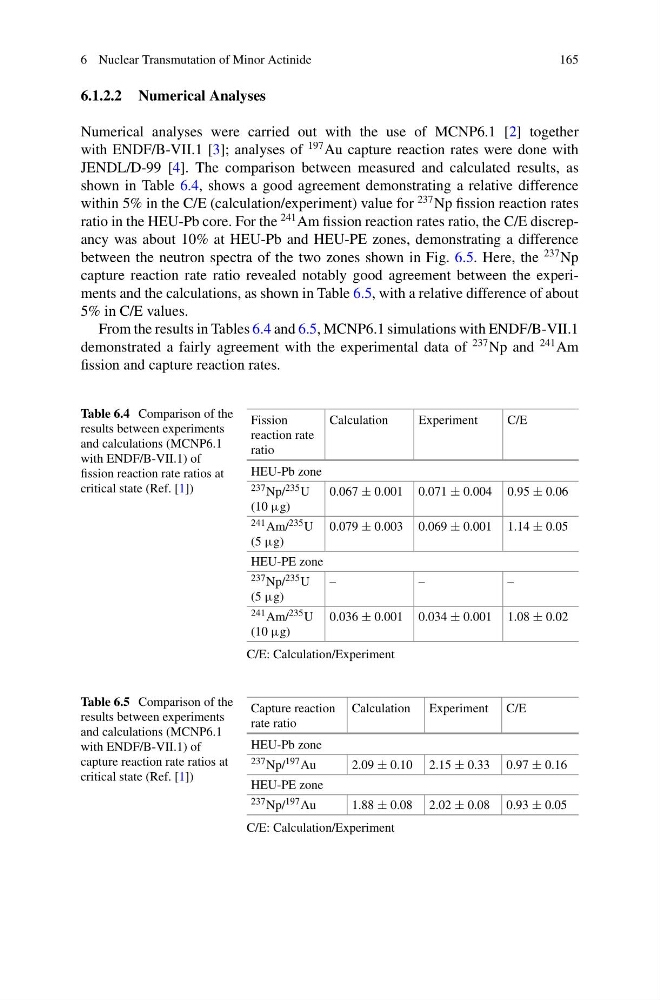
shown in Table 6.4, shows a good agreement demonstrating a relative difference
within 5% in the C/E (calculation/experiment) value for
237 Np fission reaction rates
ratio in the HEU-Pb core. For the
241 Am fission reaction rates ratio, the C/E discrepancy was about 10% at HEU-Pb and HEU-PE zones, demonstrating a difference
between the neutron spectra of the two zones shown in Fig. 6.5. Here, the
237 Np
capture reaction rate ratio revealed notably good agreement between the experiments and the calculations, as shown in Table 6.5, with a relative difference of about
5% in C/E values.
From the results in Tables 6.4 and 6.5, MCNP6.1 simulations with ENDF/B-VII.1
demonstrated a fairly agreement with the experimental data of
237 Np and
241 Am
fission and capture reaction rates.
Table 6.4 Comparison of the
results between experiments
and calculations (MCNP6.1
with ENDF/B-VII.1) of
fission reaction rate ratios at
critical state (Ref. [1])
Fission
reaction rate
ratio
Calculation
Experiment
C/E
HEU-Pb zone
237 Np/ 235 U
(10 μg)
0.067 ± 0.001 0.071 ± 0.004 0.95 ± 0.06
241 Am/ 235 U
(5 μg)
0.079 ± 0.003 0.069 ± 0.001 1.14 ± 0.05
HEU-PE zone
237 Np/ 235 U
(5 μg)
–
–
–
241 Am/ 235 U
(10 μg)
0.036 ± 0.001 0.034 ± 0.001 1.08 ± 0.02
C/E: Calculation/Experiment
Table 6.5 Comparison of the
results between experiments
and calculations (MCNP6.1
with ENDF/B-VII.1) of
capture reaction rate ratios at
critical state (Ref. [1])
Capture reaction
rate ratio
Calculation Experiment C/E
HEU-Pb zone
237 Np/ 197 Au
2.09 ± 0.10 2.15 ± 0.33 0.97 ± 0.16
HEU-PE zone
237 Np/ 197 Au
1.88 ± 0.08 2.02 ± 0.08 0.93 ± 0.05
C/E: Calculation/Experiment
165
6.1.2.2 Numerical Analyses
Numerical analyses were carried out with the use of MCNP6.1 [2] together
with ENDF/B-VII.1 [3]; analyses of
197 Au capture reaction rates were done with
JENDL/D-99 [4]. The comparison between measured and calculated results, as
shown in Table 6.4, shows a good agreement demonstrating a relative difference
within 5% in the C/E (calculation/experiment) value for
237 Np fission reaction rates
ratio in the HEU-Pb core. For the
241 Am fission reaction rates ratio, the C/E discrepancy was about 10% at HEU-Pb and HEU-PE zones, demonstrating a difference
between the neutron spectra of the two zones shown in Fig. 6.5. Here, the
237 Np
capture reaction rate ratio revealed notably good agreement between the experiments and the calculations, as shown in Table 6.5, with a relative difference of about
5% in C/E values.
From the results in Tables 6.4 and 6.5, MCNP6.1 simulations with ENDF/B-VII.1
demonstrated a fairly agreement with the experimental data of
237 Np and
241 Am
fission and capture reaction rates.
Table 6.4 Comparison of the
results between experiments
and calculations (MCNP6.1
with ENDF/B-VII.1) of
fission reaction rate ratios at
critical state (Ref. [1])
Fission
reaction rate
ratio
Calculation
Experiment
C/E
HEU-Pb zone
237 Np/ 235 U
(10 μg)
0.067 ± 0.001 0.071 ± 0.004 0.95 ± 0.06
241 Am/ 235 U
(5 μg)
0.079 ± 0.003 0.069 ± 0.001 1.14 ± 0.05
HEU-PE zone
237 Np/ 235 U
(5 μg)
–
–
–
241 Am/ 235 U
(10 μg)
0.036 ± 0.001 0.034 ± 0.001 1.08 ± 0.02
C/E: Calculation/Experiment
Table 6.5 Comparison of the
results between experiments
and calculations (MCNP6.1
with ENDF/B-VII.1) of
capture reaction rate ratios at
critical state (Ref. [1])
Capture reaction
rate ratio
Calculation Experiment C/E
HEU-Pb zone
237 Np/ 197 Au
2.09 ± 0.10 2.15 ± 0.33 0.97 ± 0.16
HEU-PE zone
237 Np/ 197 Au
1.88 ± 0.08 2.02 ± 0.08 0.93 ± 0.05
C/E: Calculation/Experiment