

5 Neutron Spectrum
139
Compared with the numerical results of
235 U fission ratio and In ratio, the assumption in Eqs. (5.11) and (5.12) is considered mostly valid with a relative difference of
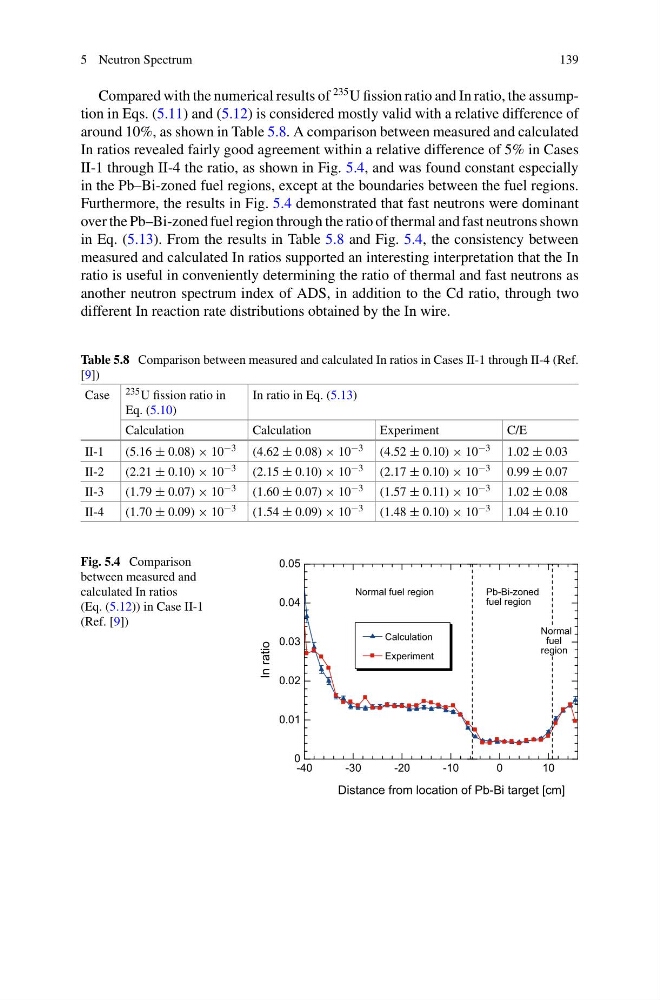
around 10%, as shown in Table 5.8. A comparison between measured and calculated
In ratios revealed fairly good agreement within a relative difference of 5% in Cases
II-1 through II-4 the ratio, as shown in Fig. 5.4, and was found constant especially
in the Pb–Bi-zoned fuel regions, except at the boundaries between the fuel regions.
Furthermore, the results in Fig. 5.4 demonstrated that fast neutrons were dominant
over the Pb–Bi-zoned fuel region through the ratio of thermal and fast neutrons shown
in Eq. (5.13). From the results in Table 5.8 and Fig. 5.4, the consistency between
measured and calculated In ratios supported an interesting interpretation that the In
ratio is useful in conveniently determining the ratio of thermal and fast neutrons as
another neutron spectrum index of ADS, in addition to the Cd ratio, through two
different In reaction rate distributions obtained by the In wire.
Table 5.8 Comparison between measured and calculated In ratios in Cases II-1 through II-4 (Ref.
[9])
Case 235 U fission ratio in
Eq. (5.10)
In ratio in Eq. (5.13)
Calculation
Calculation
Experiment
C/E
II-1
(5.16 ± 0.08) × 10 −3 (4.62 ± 0.08) × 10 −3 (4.52 ± 0.10) × 10 −3 1.02 ± 0.03
II-2
(2.21 ± 0.10) × 10 −3 (2.15 ± 0.10) × 10 −3 (2.17 ± 0.10) × 10 −3 0.99 ± 0.07
II-3
(1.79 ± 0.07) × 10 −3 (1.60 ± 0.07) × 10 −3 (1.57 ± 0.11) × 10 −3 1.02 ± 0.08
II-4
(1.70 ± 0.09) × 10 −3 (1.54 ± 0.09) × 10 −3 (1.48 ± 0.10) × 10 −3 1.04 ± 0.10
Fig. 5.4 Comparison
between measured and
calculated In ratios
(Eq. (5.12)) in Case II-1
(Ref. [9])
-40
-30
-20
-10
0
10
0
0.01
0.02
0.03
0.04
0.05
Distance from location of Pb-Bi target [cm]
In ratio
Normal fuel region
Pb-Bi-zoned
fuel region
Normal
fuel
region
Calculation
Experiment
139
Compared with the numerical results of
235 U fission ratio and In ratio, the assumption in Eqs. (5.11) and (5.12) is considered mostly valid with a relative difference of
around 10%, as shown in Table 5.8. A comparison between measured and calculated
In ratios revealed fairly good agreement within a relative difference of 5% in Cases
II-1 through II-4 the ratio, as shown in Fig. 5.4, and was found constant especially
in the Pb–Bi-zoned fuel regions, except at the boundaries between the fuel regions.
Furthermore, the results in Fig. 5.4 demonstrated that fast neutrons were dominant
over the Pb–Bi-zoned fuel region through the ratio of thermal and fast neutrons shown
in Eq. (5.13). From the results in Table 5.8 and Fig. 5.4, the consistency between
measured and calculated In ratios supported an interesting interpretation that the In
ratio is useful in conveniently determining the ratio of thermal and fast neutrons as
another neutron spectrum index of ADS, in addition to the Cd ratio, through two
different In reaction rate distributions obtained by the In wire.
Table 5.8 Comparison between measured and calculated In ratios in Cases II-1 through II-4 (Ref.
[9])
Case 235 U fission ratio in
Eq. (5.10)
In ratio in Eq. (5.13)
Calculation
Calculation
Experiment
C/E
II-1
(5.16 ± 0.08) × 10 −3 (4.62 ± 0.08) × 10 −3 (4.52 ± 0.10) × 10 −3 1.02 ± 0.03
II-2
(2.21 ± 0.10) × 10 −3 (2.15 ± 0.10) × 10 −3 (2.17 ± 0.10) × 10 −3 0.99 ± 0.07
II-3
(1.79 ± 0.07) × 10 −3 (1.60 ± 0.07) × 10 −3 (1.57 ± 0.11) × 10 −3 1.02 ± 0.08
II-4
(1.70 ± 0.09) × 10 −3 (1.54 ± 0.09) × 10 −3 (1.48 ± 0.10) × 10 −3 1.04 ± 0.10
Fig. 5.4 Comparison
between measured and
calculated In ratios
(Eq. (5.12)) in Case II-1
(Ref. [9])
-40
-30
-20
-10
0
10
0
0.01
0.02
0.03
0.04
0.05
Distance from location of Pb-Bi target [cm]
In ratio
Normal fuel region
Pb-Bi-zoned
fuel region
Normal
fuel
region
Calculation
Experiment