

134
C. H. Pyeon
Table 5.4 Comparison
between measured and
calculated (MCNP6.1) k s
values in Cases II-1 through
II-4 (Ref. [9])
Case
Calculation
Experiment
II-1
0.9989 ± 0.0005
0.9996 ± 0.0008
II-2
0.9997 ± 0.0005
0.9991 ± 0.0009
II-3
0.9990 ± 0.0005
0.9991 ± 0.0009
II-4
0.9985 ± 0.0005
0.9989 ± 0.0005
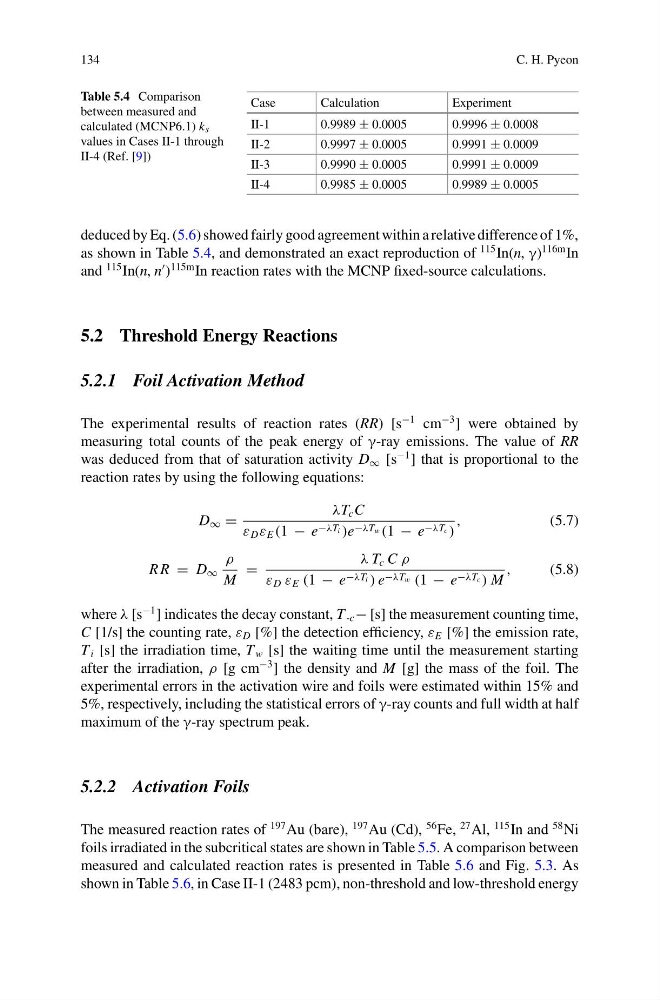
deduced by Eq. (5.6) showed fairly good agreement within a relative difference of 1%,
as shown in Table 5.4, and demonstrated an exact reproduction of
115 In(n, γ)
116m In
and
115 In(n, n
)
115m In reaction rates with the MCNP fixed-source calculations.
5.2 Threshold Energy Reactions
5.2.1 Foil Activation Method
The experimental results of reaction rates (RR) [s
−1 cm
−3 ] were obtained by
measuring total counts of the peak energy of γ-ray emissions. The value of RR
was deduced from that of saturation activity D ∞ [s
−1 ] that is proportional to the
reaction rates by using the following equations:
D ∞ =
λT c C
ε D ε E (1 − e −λT i )e −λT w (1 − e −λT c )
,
(5.7)
R R = D ∞
ρ
M
=
λ T c C ρ
ε D ε E (1 − e −λT i ) e −λT w (1 − e −λT c ) M
,
(5.8)
where λ [s
−1 ] indicates the decay constant, T -c − [s] the measurement counting time,
C [1/s] the counting rate, ε D [%] the detection efficiency, ε E [%] the emission rate,
T i [s] the irradiation time, T w [s] the waiting time until the measurement starting
after the irradiation, ρ [g cm
−3 ] the density and M [g] the mass of the foil. The
experimental errors in the activation wire and foils were estimated within 15% and
5%, respectively, including the statistical errors of γ-ray counts and full width at half
maximum of the γ-ray spectrum peak.
5.2.2 Activation Foils
The measured reaction rates of
197 Au (bare),
197 Au (Cd),
56 Fe,
27 Al,
115 In and
58 Ni
foils irradiated in the subcritical states are shown in Table 5.5. A comparison between
measured and calculated reaction rates is presented in Table 5.6 and Fig. 5.3. As
shown in Table 5.6, in Case II-1 (2483 pcm), non-threshold and low-threshold energy
C. H. Pyeon
Table 5.4 Comparison
between measured and
calculated (MCNP6.1) k s
values in Cases II-1 through
II-4 (Ref. [9])
Case
Calculation
Experiment
II-1
0.9989 ± 0.0005
0.9996 ± 0.0008
II-2
0.9997 ± 0.0005
0.9991 ± 0.0009
II-3
0.9990 ± 0.0005
0.9991 ± 0.0009
II-4
0.9985 ± 0.0005
0.9989 ± 0.0005
deduced by Eq. (5.6) showed fairly good agreement within a relative difference of 1%,
as shown in Table 5.4, and demonstrated an exact reproduction of
115 In(n, γ)
116m In
and
115 In(n, n
)
115m In reaction rates with the MCNP fixed-source calculations.
5.2 Threshold Energy Reactions
5.2.1 Foil Activation Method
The experimental results of reaction rates (RR) [s
−1 cm
−3 ] were obtained by
measuring total counts of the peak energy of γ-ray emissions. The value of RR
was deduced from that of saturation activity D ∞ [s
−1 ] that is proportional to the
reaction rates by using the following equations:
D ∞ =
λT c C
ε D ε E (1 − e −λT i )e −λT w (1 − e −λT c )
,
(5.7)
R R = D ∞
ρ
M
=
λ T c C ρ
ε D ε E (1 − e −λT i ) e −λT w (1 − e −λT c ) M
,
(5.8)
where λ [s
−1 ] indicates the decay constant, T -c − [s] the measurement counting time,
C [1/s] the counting rate, ε D [%] the detection efficiency, ε E [%] the emission rate,
T i [s] the irradiation time, T w [s] the waiting time until the measurement starting
after the irradiation, ρ [g cm
−3 ] the density and M [g] the mass of the foil. The
experimental errors in the activation wire and foils were estimated within 15% and
5%, respectively, including the statistical errors of γ-ray counts and full width at half
maximum of the γ-ray spectrum peak.
5.2.2 Activation Foils
The measured reaction rates of
197 Au (bare),
197 Au (Cd),
56 Fe,
27 Al,
115 In and
58 Ni
foils irradiated in the subcritical states are shown in Table 5.5. A comparison between
measured and calculated reaction rates is presented in Table 5.6 and Fig. 5.3. As
shown in Table 5.6, in Case II-1 (2483 pcm), non-threshold and low-threshold energy