

4 Effective Delayed Neutron Fraction
113
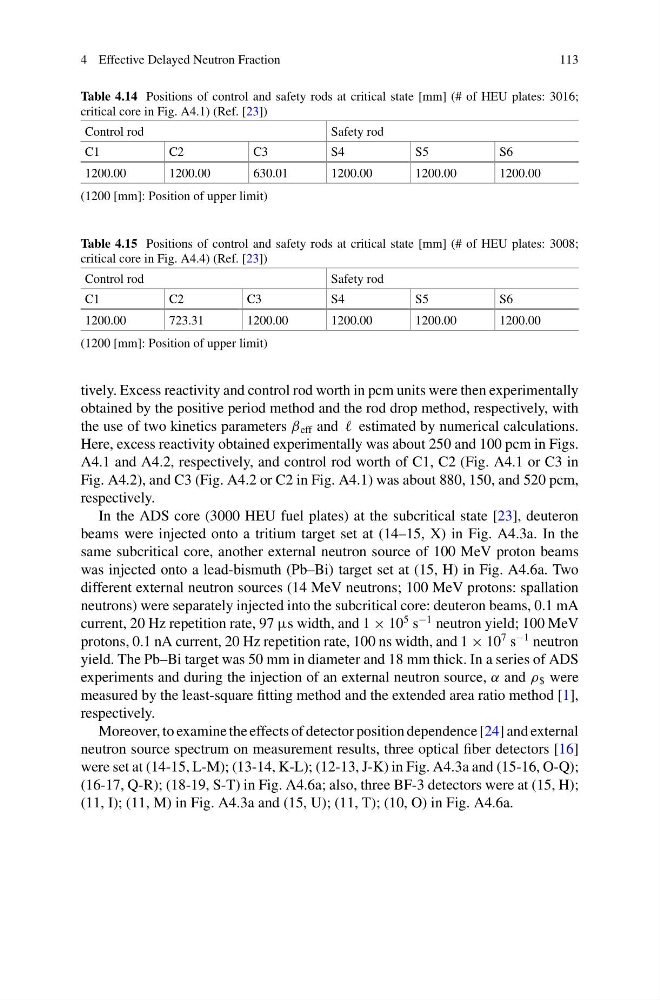
Table 4.14 Positions of control and safety rods at critical state [mm] (# of HEU plates: 3016;
critical core in Fig. A4.1) (Ref. [23])
Control rod
Safety rod
C1
C2
C3
S4
S5
S6
1200.00
1200.00
630.01
1200.00
1200.00
1200.00
(1200 [mm]: Position of upper limit)
Table 4.15 Positions of control and safety rods at critical state [mm] (# of HEU plates: 3008;
critical core in Fig. A4.4) (Ref. [23])
Control rod
Safety rod
C1
C2
C3
S4
S5
S6
1200.00
723.31
1200.00
1200.00
1200.00
1200.00
(1200 [mm]: Position of upper limit)
tively. Excess reactivity and control rod worth in pcm units were then experimentally
obtained by the positive period method and the rod drop method, respectively, with
the use of two kinetics parameters β eff and estimated by numerical calculations.
Here, excess reactivity obtained experimentally was about 250 and 100 pcm in Figs.
A4.1 and A4.2, respectively, and control rod worth of C1, C2 (Fig. A4.1 or C3 in
Fig. A4.2), and C3 (Fig. A4.2 or C2 in Fig. A4.1) was about 880, 150, and 520 pcm,
respectively.
In the ADS core (3000 HEU fuel plates) at the subcritical state [23], deuteron
beams were injected onto a tritium target set at (14–15, X) in Fig. A4.3a. In the
same subcritical core, another external neutron source of 100 MeV proton beams
was injected onto a lead-bismuth (Pb–Bi) target set at (15, H) in Fig. A4.6a. Two
different external neutron sources (14 MeV neutrons; 100 MeV protons: spallation
neutrons) were separately injected into the subcritical core: deuteron beams, 0.1 mA
current, 20 Hz repetition rate, 97 μs width, and 1 × 10
5 s
−1 neutron yield; 100 MeV
protons, 0.1 nA current, 20 Hz repetition rate, 100 ns width, and 1 × 10
7 s
−1 neutron
yield. The Pb–Bi target was 50 mm in diameter and 18 mm thick. In a series of ADS
experiments and during the injection of an external neutron source, α and ρ $ were
measured by the least-square fitting method and the extended area ratio method [1],
respectively.
Moreover, to examine the effects of detector position dependence [24] and external
neutron source spectrum on measurement results, three optical fiber detectors [16]
were set at (14-15, L-M); (13-14, K-L); (12-13, J-K) in Fig. A4.3a and (15-16, O-Q);
(16-17, Q-R); (18-19, S-T) in Fig. A4.6a; also, three BF-3 detectors were at (15, H);
(11, I); (11, M) in Fig. A4.3a and (15, U); (11, T); (10, O) in Fig. A4.6a.
113
Table 4.14 Positions of control and safety rods at critical state [mm] (# of HEU plates: 3016;
critical core in Fig. A4.1) (Ref. [23])
Control rod
Safety rod
C1
C2
C3
S4
S5
S6
1200.00
1200.00
630.01
1200.00
1200.00
1200.00
(1200 [mm]: Position of upper limit)
Table 4.15 Positions of control and safety rods at critical state [mm] (# of HEU plates: 3008;
critical core in Fig. A4.4) (Ref. [23])
Control rod
Safety rod
C1
C2
C3
S4
S5
S6
1200.00
723.31
1200.00
1200.00
1200.00
1200.00
(1200 [mm]: Position of upper limit)
tively. Excess reactivity and control rod worth in pcm units were then experimentally
obtained by the positive period method and the rod drop method, respectively, with
the use of two kinetics parameters β eff and estimated by numerical calculations.
Here, excess reactivity obtained experimentally was about 250 and 100 pcm in Figs.
A4.1 and A4.2, respectively, and control rod worth of C1, C2 (Fig. A4.1 or C3 in
Fig. A4.2), and C3 (Fig. A4.2 or C2 in Fig. A4.1) was about 880, 150, and 520 pcm,
respectively.
In the ADS core (3000 HEU fuel plates) at the subcritical state [23], deuteron
beams were injected onto a tritium target set at (14–15, X) in Fig. A4.3a. In the
same subcritical core, another external neutron source of 100 MeV proton beams
was injected onto a lead-bismuth (Pb–Bi) target set at (15, H) in Fig. A4.6a. Two
different external neutron sources (14 MeV neutrons; 100 MeV protons: spallation
neutrons) were separately injected into the subcritical core: deuteron beams, 0.1 mA
current, 20 Hz repetition rate, 97 μs width, and 1 × 10
5 s
−1 neutron yield; 100 MeV
protons, 0.1 nA current, 20 Hz repetition rate, 100 ns width, and 1 × 10
7 s
−1 neutron
yield. The Pb–Bi target was 50 mm in diameter and 18 mm thick. In a series of ADS
experiments and during the injection of an external neutron source, α and ρ $ were
measured by the least-square fitting method and the extended area ratio method [1],
respectively.
Moreover, to examine the effects of detector position dependence [24] and external
neutron source spectrum on measurement results, three optical fiber detectors [16]
were set at (14-15, L-M); (13-14, K-L); (12-13, J-K) in Fig. A4.3a and (15-16, O-Q);
(16-17, Q-R); (18-19, S-T) in Fig. A4.6a; also, three BF-3 detectors were at (15, H);
(11, I); (11, M) in Fig. A4.3a and (15, U); (11, T); (10, O) in Fig. A4.6a.