

108
M. Yamanaka
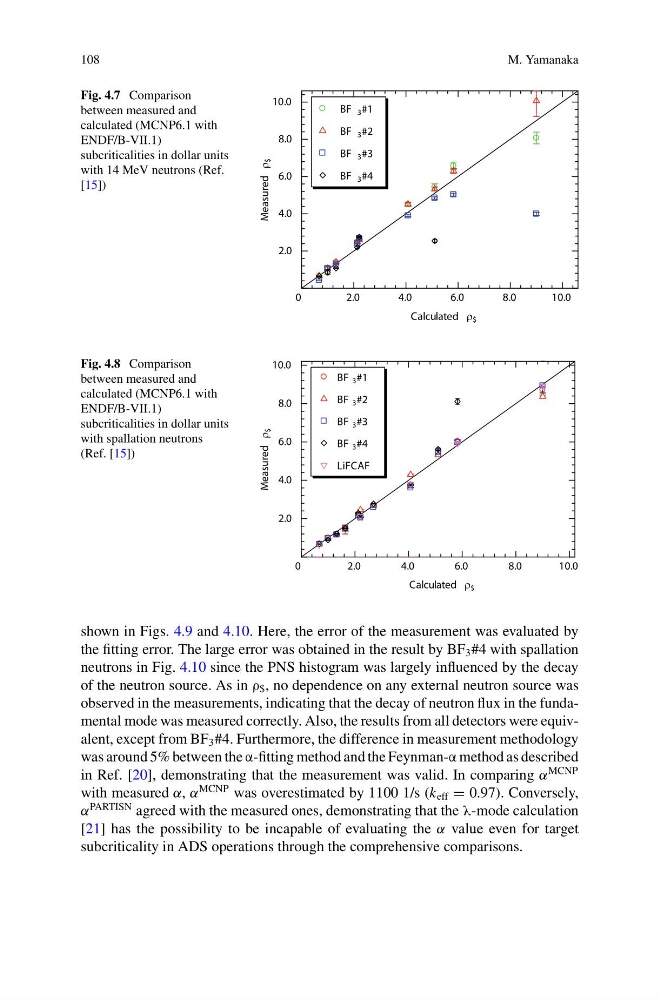
Fig. 4.7 Comparison
between measured and
calculated (MCNP6.1 with
ENDF/B-VII.1)
subcriticalities in dollar units
with 14 MeV neutrons (Ref.
[15])
2.0
4.0
6.0
8.0
10.0
2.0
4.0
6.0
8.0
10.0
0
Calculated $
Measured
$
BF 3 #1
BF 3 #2
BF 3 #3
BF 3 #4
Fig. 4.8 Comparison
between measured and
calculated (MCNP6.1 with
ENDF/B-VII.1)
subcriticalities in dollar units
with spallation neutrons
(Ref. [15])
2.0
4.0
6.0
8.0
10.0
2.0
4.0
6.0
8.0
10.0
0
Calculated $
Measured
$
BF 3 #1
BF 3 #2
BF 3 #3
BF 3 #4
LiFCAF
shown in Figs. 4.9 and 4.10. Here, the error of the measurement was evaluated by
the fitting error. The large error was obtained in the result by BF 3 #4 with spallation
neutrons in Fig. 4.10 since the PNS histogram was largely influenced by the decay
of the neutron source. As in ρ $ , no dependence on any external neutron source was
observed in the measurements, indicating that the decay of neutron flux in the fundamental mode was measured correctly. Also, the results from all detectors were equivalent, except from BF 3 #4. Furthermore, the difference in measurement methodology
was around 5% between the α-fitting method and the Feynman-α method as described
in Ref. [20], demonstrating that the measurement was valid. In comparing α
MCNP
with measured α, α
MCNP was overestimated by 1100 1/s (k eff = 0.97). Conversely,
α
PARTISN agreed with the measured ones, demonstrating that the λ-mode calculation
[21] has the possibility to be incapable of evaluating the α value even for target
subcriticality in ADS operations through the comprehensive comparisons.
M. Yamanaka
Fig. 4.7 Comparison
between measured and
calculated (MCNP6.1 with
ENDF/B-VII.1)
subcriticalities in dollar units
with 14 MeV neutrons (Ref.
[15])
2.0
4.0
6.0
8.0
10.0
2.0
4.0
6.0
8.0
10.0
0
Calculated $
Measured
$
BF 3 #1
BF 3 #2
BF 3 #3
BF 3 #4
Fig. 4.8 Comparison
between measured and
calculated (MCNP6.1 with
ENDF/B-VII.1)
subcriticalities in dollar units
with spallation neutrons
(Ref. [15])
2.0
4.0
6.0
8.0
10.0
2.0
4.0
6.0
8.0
10.0
0
Calculated $
Measured
$
BF 3 #1
BF 3 #2
BF 3 #3
BF 3 #4
LiFCAF
shown in Figs. 4.9 and 4.10. Here, the error of the measurement was evaluated by
the fitting error. The large error was obtained in the result by BF 3 #4 with spallation
neutrons in Fig. 4.10 since the PNS histogram was largely influenced by the decay
of the neutron source. As in ρ $ , no dependence on any external neutron source was
observed in the measurements, indicating that the decay of neutron flux in the fundamental mode was measured correctly. Also, the results from all detectors were equivalent, except from BF 3 #4. Furthermore, the difference in measurement methodology
was around 5% between the α-fitting method and the Feynman-α method as described
in Ref. [20], demonstrating that the measurement was valid. In comparing α
MCNP
with measured α, α
MCNP was overestimated by 1100 1/s (k eff = 0.97). Conversely,
α
PARTISN agreed with the measured ones, demonstrating that the λ-mode calculation
[21] has the possibility to be incapable of evaluating the α value even for target
subcriticality in ADS operations through the comprehensive comparisons.