

4 Effective Delayed Neutron Fraction
105
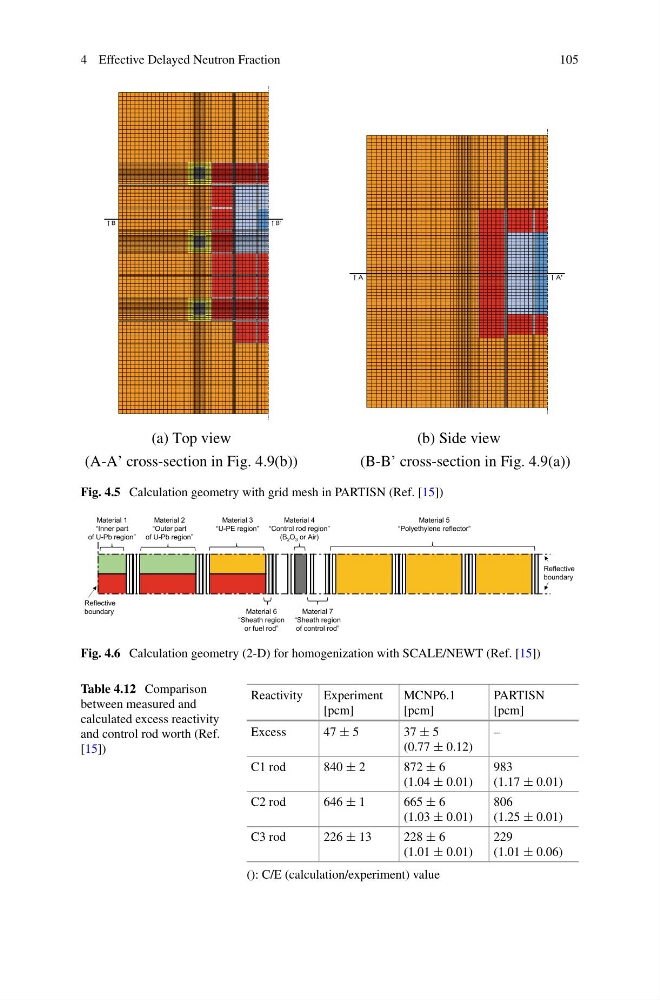
(a) Top view
(b) Side view
(A-A’ cross-section in Fig. 4.9(b))
(B-B’ cross-section in Fig. 4.9(a))
Fig. 4.5 Calculation geometry with grid mesh in PARTISN (Ref. [15])
Fig. 4.6 Calculation geometry (2-D) for homogenization with SCALE/NEWT (Ref. [15])
Table 4.12 Comparison
between measured and
calculated excess reactivity
and control rod worth (Ref.
[15])
Reactivity
Experiment
[pcm]
MCNP6.1
[pcm]
PARTISN
[pcm]
Excess
47 ± 5
37 ± 5
(0.77 ± 0.12)
–
C1 rod
840 ± 2
872 ± 6
(1.04 ± 0.01)
983
(1.17 ± 0.01)
C2 rod
646 ± 1
665 ± 6
(1.03 ± 0.01)
806
(1.25 ± 0.01)
C3 rod
226 ± 13
228 ± 6
(1.01 ± 0.01)
229
(1.01 ± 0.06)
(): C/E (calculation/experiment) value
105
(a) Top view
(b) Side view
(A-A’ cross-section in Fig. 4.9(b))
(B-B’ cross-section in Fig. 4.9(a))
Fig. 4.5 Calculation geometry with grid mesh in PARTISN (Ref. [15])
Fig. 4.6 Calculation geometry (2-D) for homogenization with SCALE/NEWT (Ref. [15])
Table 4.12 Comparison
between measured and
calculated excess reactivity
and control rod worth (Ref.
[15])
Reactivity
Experiment
[pcm]
MCNP6.1
[pcm]
PARTISN
[pcm]
Excess
47 ± 5
37 ± 5
(0.77 ± 0.12)
–
C1 rod
840 ± 2
872 ± 6
(1.04 ± 0.01)
983
(1.17 ± 0.01)
C2 rod
646 ± 1
665 ± 6
(1.03 ± 0.01)
806
(1.25 ± 0.01)
C3 rod
226 ± 13
228 ± 6
(1.01 ± 0.01)
229
(1.01 ± 0.06)
(): C/E (calculation/experiment) value