

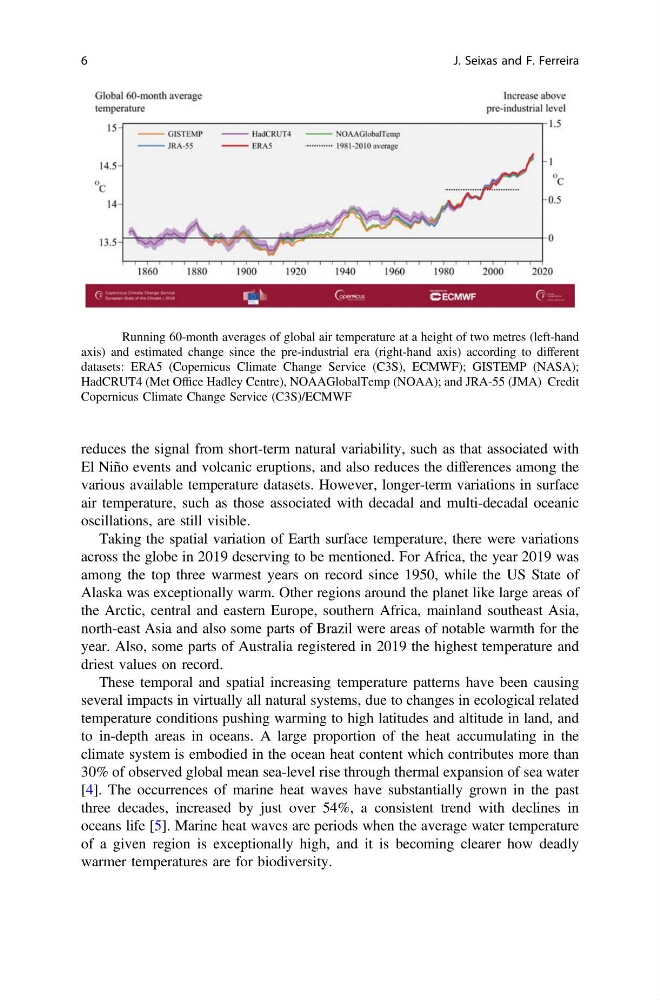
reduces the signal from short-term natural variability, such as that associated with
El Niño events and volcanic eruptions, and also reduces the differences among the
various available temperature datasets. However, longer-term variations in surface
air temperature, such as those associated with decadal and multi-decadal oceanic
oscillations, are still visible.
Taking the spatial variation of Earth surface temperature, there were variations
across the globe in 2019 deserving to be mentioned. For Africa, the year 2019 was
among the top three warmest years on record since 1950, while the US State of
Alaska was exceptionally warm. Other regions around the planet like large areas of
the Arctic, central and eastern Europe, southern Africa, mainland southeast Asia,
north-east Asia and also some parts of Brazil were areas of notable warmth for the
year. Also, some parts of Australia registered in 2019 the highest temperature and
driest values on record.
These temporal and spatial increasing temperature patterns have been causing
several impacts in virtually all natural systems, due to changes in ecological related
temperature conditions pushing warming to high latitudes and altitude in land, and
to in-depth areas in oceans. A large proportion of the heat accumulating in the
climate system is embodied in the ocean heat content which contributes more than
30% of observed global mean sea-level rise through thermal expansion of sea water
[4]. The occurrences of marine heat waves have substantially grown in the past
three decades, increased by just over 54%, a consistent trend with declines in
oceans life [5]. Marine heat waves are periods when the average water temperature
of a given region is exceptionally high, and it is becoming clearer how deadly
warmer temperatures are for biodiversity.
Fig. 1 Running 60-month averages of global air temperature at a height of two metres (left-hand
axis) and estimated change since the pre-industrial era (right-hand axis) according to different
datasets: ERA5 (Copernicus Climate Change Service (C3S), ECMWF); GISTEMP (NASA);
HadCRUT4 (Met Office Hadley Centre), NOAAGlobalTemp (NOAA); and JRA-55 (JMA) Credit
Copernicus Climate Change Service (C3S)/ECMWF
6
J. Seixas and F. Ferreira
El Niño events and volcanic eruptions, and also reduces the differences among the
various available temperature datasets. However, longer-term variations in surface
air temperature, such as those associated with decadal and multi-decadal oceanic
oscillations, are still visible.
Taking the spatial variation of Earth surface temperature, there were variations
across the globe in 2019 deserving to be mentioned. For Africa, the year 2019 was
among the top three warmest years on record since 1950, while the US State of
Alaska was exceptionally warm. Other regions around the planet like large areas of
the Arctic, central and eastern Europe, southern Africa, mainland southeast Asia,
north-east Asia and also some parts of Brazil were areas of notable warmth for the
year. Also, some parts of Australia registered in 2019 the highest temperature and
driest values on record.
These temporal and spatial increasing temperature patterns have been causing
several impacts in virtually all natural systems, due to changes in ecological related
temperature conditions pushing warming to high latitudes and altitude in land, and
to in-depth areas in oceans. A large proportion of the heat accumulating in the
climate system is embodied in the ocean heat content which contributes more than
30% of observed global mean sea-level rise through thermal expansion of sea water
[4]. The occurrences of marine heat waves have substantially grown in the past
three decades, increased by just over 54%, a consistent trend with declines in
oceans life [5]. Marine heat waves are periods when the average water temperature
of a given region is exceptionally high, and it is becoming clearer how deadly
warmer temperatures are for biodiversity.
Fig. 1 Running 60-month averages of global air temperature at a height of two metres (left-hand
axis) and estimated change since the pre-industrial era (right-hand axis) according to different
datasets: ERA5 (Copernicus Climate Change Service (C3S), ECMWF); GISTEMP (NASA);
HadCRUT4 (Met Office Hadley Centre), NOAAGlobalTemp (NOAA); and JRA-55 (JMA) Credit
Copernicus Climate Change Service (C3S)/ECMWF
6
J. Seixas and F. Ferreira