

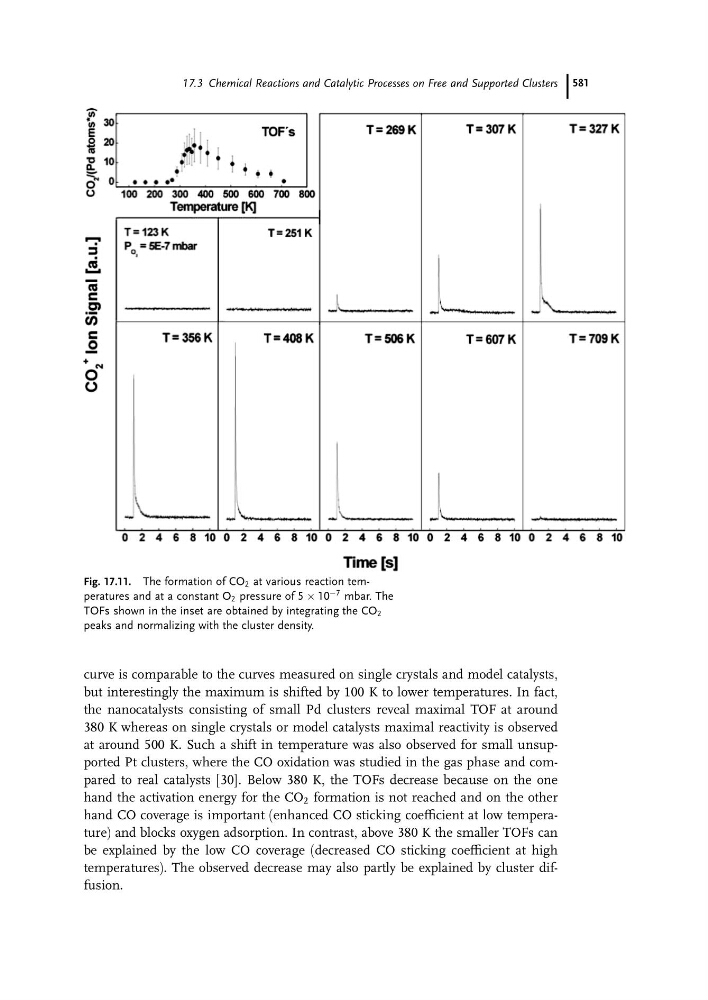
curve is comparable to the curves measured on single crystals and model catalysts,
but interestingly the maximum is shifted by 100 K to lower temperatures. In fact,
the nanocatalysts consisting of small Pd clusters reveal maximal TOF at around
380 K whereas on single crystals or model catalysts maximal reactivity is observed
at around 500 K. Such a shift in temperature was also observed for small unsupported Pt clusters, where the CO oxidation was studied in the gas phase and compared to real catalysts [30]. Below 380 K, the TOFs decrease because on the one
hand the activation energy for the CO 2 formation is not reached and on the other
hand CO coverage is important (enhanced CO sticking coefficient at low temperature) and blocks oxygen adsorption. In contrast, above 380 K the smaller TOFs can
be explained by the low CO coverage (decreased CO sticking coefficient at high
temperatures). The observed decrease may also partly be explained by cluster diffusion.
Fig. 17.11. The formation of CO 2 at various reaction temperatures and at a constant O 2 pressure of 5 Â 10
À7 mbar. The
TOFs shown in the inset are obtained by integrating the CO 2
peaks and normalizing with the cluster density.
17.3 Chemical Reactions and Catalytic Processes on Free and Supported Clusters 581