

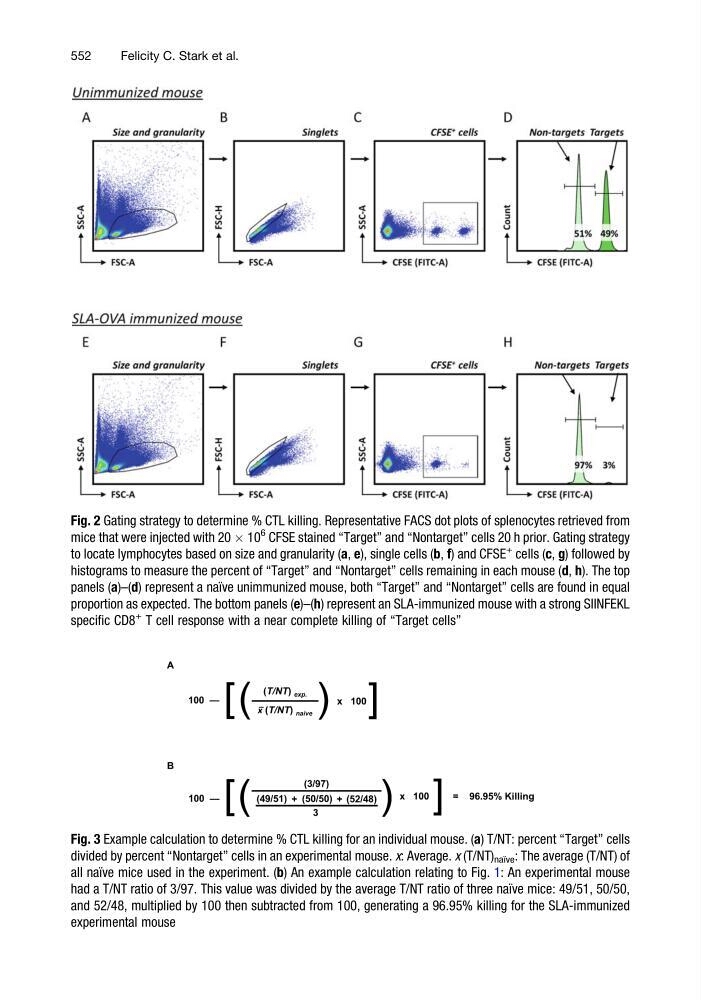
Fig. 2 Gating strategy to determine % CTL killing. Representative FACS dot plots of splenocytes retrieved from
mice that were injected with 20 Â 10
6 CFSE stained “Target” and “Nontarget” cells 20 h prior. Gating strategy
to locate lymphocytes based on size and granularity (a, e), single cells (b, f) and CFSE
+ cells (c, g) followed by
histograms to measure the percent of “Target” and “Nontarget” cells remaining in each mouse (d, h). The top
panels (a)–(d) represent a naı ¨ve unimmunized mouse, both “Target” and “Nontarget” cells are found in equal
proportion as expected. The bottom panels (e)–(h) represent an SLA-immunized mouse with a strong SIINFEKL
specific CD8
+ T cell response with a near complete killing of “Target cells”
Fig. 3 Example calculation to determine % CTL killing for an individual mouse. (a) T/NT: percent “Target” cells
divided by percent “Nontarget” cells in an experimental mouse. x: Average. x (T/NT) naı ¨ve : The average (T/NT) of
all naı ¨ve mice used in the experiment. (b) An example calculation relating to Fig. 1: An experimental mouse
had a T/NT ratio of 3/97. This value was divided by the average T/NT ratio of three naı ¨ve mice: 49/51, 50/50,
and 52/48, multiplied by 100 then subtracted from 100, generating a 96.95% killing for the SLA-immunized
experimental mouse
552
Felicity C. Stark et al.
mice that were injected with 20 Â 10
6 CFSE stained “Target” and “Nontarget” cells 20 h prior. Gating strategy
to locate lymphocytes based on size and granularity (a, e), single cells (b, f) and CFSE
+ cells (c, g) followed by
histograms to measure the percent of “Target” and “Nontarget” cells remaining in each mouse (d, h). The top
panels (a)–(d) represent a naı ¨ve unimmunized mouse, both “Target” and “Nontarget” cells are found in equal
proportion as expected. The bottom panels (e)–(h) represent an SLA-immunized mouse with a strong SIINFEKL
specific CD8
+ T cell response with a near complete killing of “Target cells”
Fig. 3 Example calculation to determine % CTL killing for an individual mouse. (a) T/NT: percent “Target” cells
divided by percent “Nontarget” cells in an experimental mouse. x: Average. x (T/NT) naı ¨ve : The average (T/NT) of
all naı ¨ve mice used in the experiment. (b) An example calculation relating to Fig. 1: An experimental mouse
had a T/NT ratio of 3/97. This value was divided by the average T/NT ratio of three naı ¨ve mice: 49/51, 50/50,
and 52/48, multiplied by 100 then subtracted from 100, generating a 96.95% killing for the SLA-immunized
experimental mouse
552
Felicity C. Stark et al.