

5. Prepare a negative control containing the free carrier protein
(50–100 μg) (see Note 12) by the same protocol and use it to
blank the UV-Vis spectrometer.
6. Transfer the content in each test tube to a cuvette.
7. Measure the A 490 value of each sample with a UV-Vis
spectrometer.
8. Use the A 490 and sample weight (μg) data to plot calibration
curve.
Measurement of carbohydrate loading of glycoconjugate
1. Add 50–100 μg of accurately weighed conjugate, 500 μL of 4%
phenol, and 2.5 mL of 96% H 2 SO 4 to a test tube (see Note 11).
2. Transfer the content of the test tube to a cuvette.
3. Measure the A 490 value of the sample with a UV-Vis
spectrometer.
4. Use the calibration curve to determine the weight of carbohydrates in the conjugate sample.
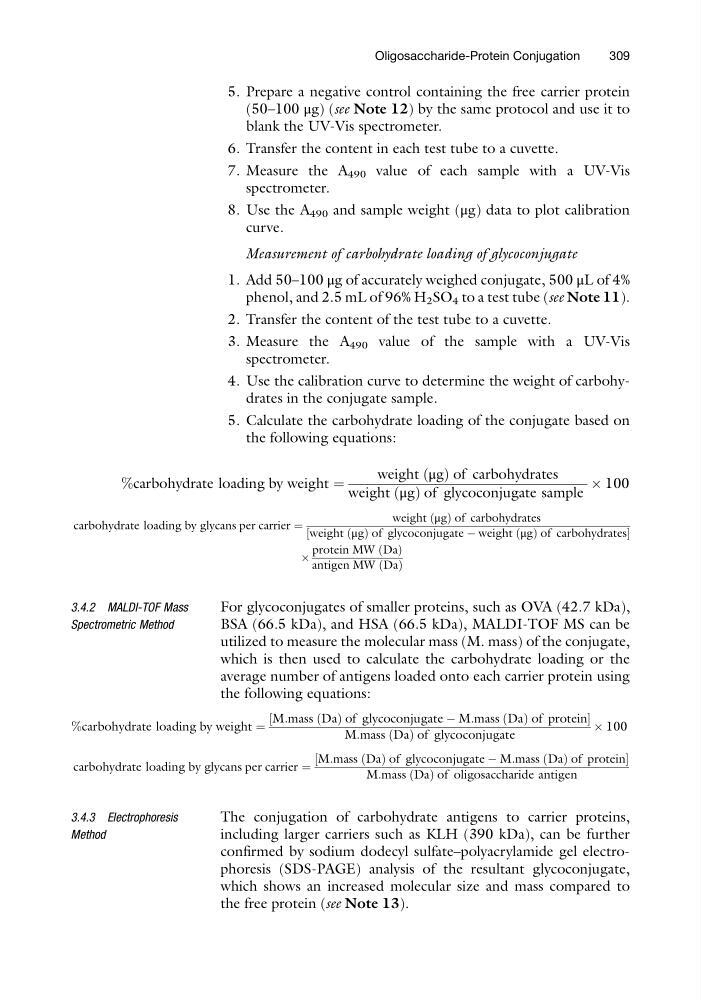
5. Calculate the carbohydrate loading of the conjugate based on
the following equations:
%carbohydrate loading by weight ¼
weight μg
ð Þ of carbohydrates
weight μg
ð Þ of glycoconjugate sample
 100
carbohydrate loading by glycans per carrier ¼
weight μg
ð Þ of carbohydrates
weight μg
ð Þ of glycoconjugate À weight μg
ð Þ of carbohydrates
½
Â
protein MW Da
ð Þ
antigen MW Da
ð Þ
3.4.2 MALDI-TOF Mass
Spectrometric Method
For glycoconjugates of smaller proteins, such as OVA (42.7 kDa),
BSA (66.5 kDa), and HSA (66.5 kDa), MALDI-TOF MS can be
utilized to measure the molecular mass (M. mass) of the conjugate,
which is then used to calculate the carbohydrate loading or the
average number of antigens loaded onto each carrier protein using
the following equations:
%carbohydrate loading by weight ¼
M:mass Da
ð Þ of glycoconjugate À M:mass Da
ð Þ of protein
½
M:mass Da
ð Þ of glycoconjugate
 100
carbohydrate loading by glycans per carrier ¼
M:mass Da
ð Þ of glycoconjugate À M:mass Da
ð Þ of protein
½
M:mass Da
ð Þ of oligosaccharide antigen
3.4.3 Electrophoresis
Method
The conjugation of carbohydrate antigens to carrier proteins,
including larger carriers such as KLH (390 kDa), can be further
confirmed by sodium dodecyl sulfate–polyacrylamide gel electrophoresis (SDS-PAGE) analysis of the resultant glycoconjugate,
which shows an increased molecular size and mass compared to
the free protein (see Note 13).
Oligosaccharide-Protein Conjugation
309
(50–100 μg) (see Note 12) by the same protocol and use it to
blank the UV-Vis spectrometer.
6. Transfer the content in each test tube to a cuvette.
7. Measure the A 490 value of each sample with a UV-Vis
spectrometer.
8. Use the A 490 and sample weight (μg) data to plot calibration
curve.
Measurement of carbohydrate loading of glycoconjugate
1. Add 50–100 μg of accurately weighed conjugate, 500 μL of 4%
phenol, and 2.5 mL of 96% H 2 SO 4 to a test tube (see Note 11).
2. Transfer the content of the test tube to a cuvette.
3. Measure the A 490 value of the sample with a UV-Vis
spectrometer.
4. Use the calibration curve to determine the weight of carbohydrates in the conjugate sample.
5. Calculate the carbohydrate loading of the conjugate based on
the following equations:
%carbohydrate loading by weight ¼
weight μg
ð Þ of carbohydrates
weight μg
ð Þ of glycoconjugate sample
 100
carbohydrate loading by glycans per carrier ¼
weight μg
ð Þ of carbohydrates
weight μg
ð Þ of glycoconjugate À weight μg
ð Þ of carbohydrates
½
Â
protein MW Da
ð Þ
antigen MW Da
ð Þ
3.4.2 MALDI-TOF Mass
Spectrometric Method
For glycoconjugates of smaller proteins, such as OVA (42.7 kDa),
BSA (66.5 kDa), and HSA (66.5 kDa), MALDI-TOF MS can be
utilized to measure the molecular mass (M. mass) of the conjugate,
which is then used to calculate the carbohydrate loading or the
average number of antigens loaded onto each carrier protein using
the following equations:
%carbohydrate loading by weight ¼
M:mass Da
ð Þ of glycoconjugate À M:mass Da
ð Þ of protein
½
M:mass Da
ð Þ of glycoconjugate
 100
carbohydrate loading by glycans per carrier ¼
M:mass Da
ð Þ of glycoconjugate À M:mass Da
ð Þ of protein
½
M:mass Da
ð Þ of oligosaccharide antigen
3.4.3 Electrophoresis
Method
The conjugation of carbohydrate antigens to carrier proteins,
including larger carriers such as KLH (390 kDa), can be further
confirmed by sodium dodecyl sulfate–polyacrylamide gel electrophoresis (SDS-PAGE) analysis of the resultant glycoconjugate,
which shows an increased molecular size and mass compared to
the free protein (see Note 13).
Oligosaccharide-Protein Conjugation
309