

(b) Calculate void and bed volume calibration injecting
λ-DNA and NaN 3 , respectively. For Kd determination,
the following equation is used: Kd ¼ (T e À T 0 )/(T t À T 0 )
where: T e ¼ elution time of the analyte, T 0 ¼ elution time
of the biggest fragment of λ-DNA and T t ¼ elution time
of NaN3.
(c) Column compartment: 30
C.
(d) Autosampler compartment: 4
C.
(e) Detector: OAg peaks are detected by differential refractive index (dRI), while UV detection at 214 nm and
280 nm are used for free protein and conjugate detection. Protein and conjugate peaks are also detected using
tryptophan fluorescence (emission spectrum at 336 nm,
with excitation wavelength at 280 nm).
2. Chromatographic conditions:
(a) Mobile phase: 0.1 M NaCl, 0.1 M NaH 2 PO 4 , 5% ACN,
pH 7.2.
(b) Flow rate: 0.5 mL/min.
(c) Run time: isocratic for 30 min.
(d) Sample injection volume: 80 μL.
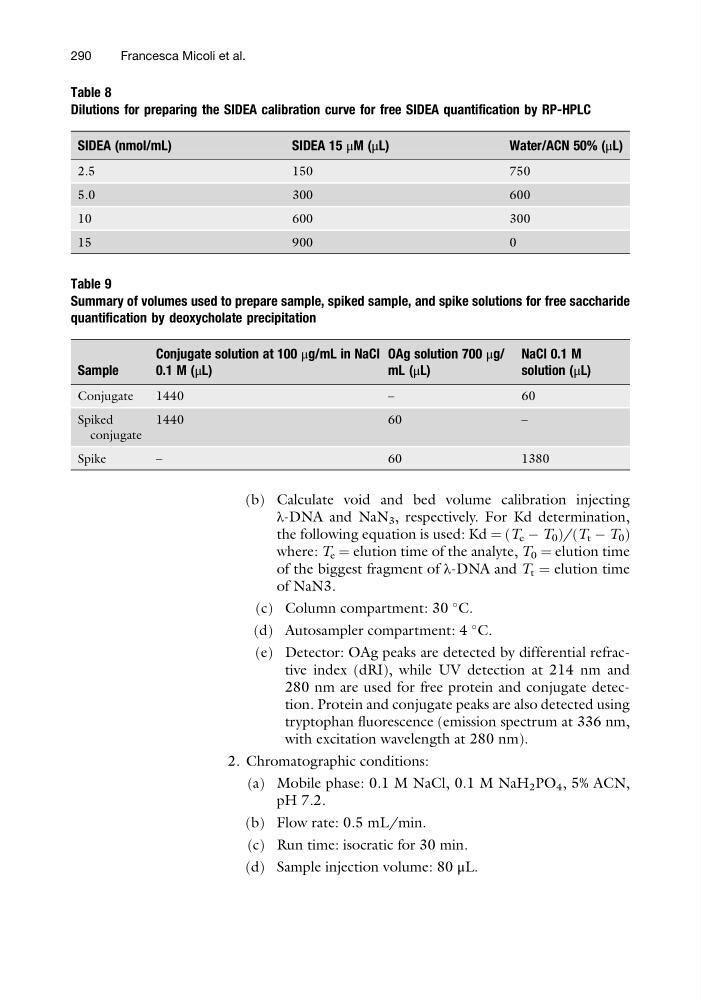
Table 8
Dilutions for preparing the SIDEA calibration curve for free SIDEA quantification by RP-HPLC
SIDEA (nmol/mL)
SIDEA 15 μM (μL)
Water/ACN 50% (μL)
2.5
150
750
5.0
300
600
10
600
300
15
900
0
Table 9
Summary of volumes used to prepare sample, spiked sample, and spike solutions for free saccharide
quantification by deoxycholate precipitation
Sample
Conjugate solution at 100 μg/mL in NaCl
0.1 M (μL)
OAg solution 700 μg/
mL (μL)
NaCl 0.1 M
solution (μL)
Conjugate
1440
–
60
Spiked
conjugate
1440
60
–
Spike
–
60
1380
290
Francesca Micoli et al.
λ-DNA and NaN 3 , respectively. For Kd determination,
the following equation is used: Kd ¼ (T e À T 0 )/(T t À T 0 )
where: T e ¼ elution time of the analyte, T 0 ¼ elution time
of the biggest fragment of λ-DNA and T t ¼ elution time
of NaN3.
(c) Column compartment: 30
C.
(d) Autosampler compartment: 4
C.
(e) Detector: OAg peaks are detected by differential refractive index (dRI), while UV detection at 214 nm and
280 nm are used for free protein and conjugate detection. Protein and conjugate peaks are also detected using
tryptophan fluorescence (emission spectrum at 336 nm,
with excitation wavelength at 280 nm).
2. Chromatographic conditions:
(a) Mobile phase: 0.1 M NaCl, 0.1 M NaH 2 PO 4 , 5% ACN,
pH 7.2.
(b) Flow rate: 0.5 mL/min.
(c) Run time: isocratic for 30 min.
(d) Sample injection volume: 80 μL.
Table 8
Dilutions for preparing the SIDEA calibration curve for free SIDEA quantification by RP-HPLC
SIDEA (nmol/mL)
SIDEA 15 μM (μL)
Water/ACN 50% (μL)
2.5
150
750
5.0
300
600
10
600
300
15
900
0
Table 9
Summary of volumes used to prepare sample, spiked sample, and spike solutions for free saccharide
quantification by deoxycholate precipitation
Sample
Conjugate solution at 100 μg/mL in NaCl
0.1 M (μL)
OAg solution 700 μg/
mL (μL)
NaCl 0.1 M
solution (μL)
Conjugate
1440
–
60
Spiked
conjugate
1440
60
–
Spike
–
60
1380
290
Francesca Micoli et al.