

180
4 Light Sources for Fiber Links
Lasing efficiency
η eff = dP/dI
Laser regime
LED regime
Threshold current
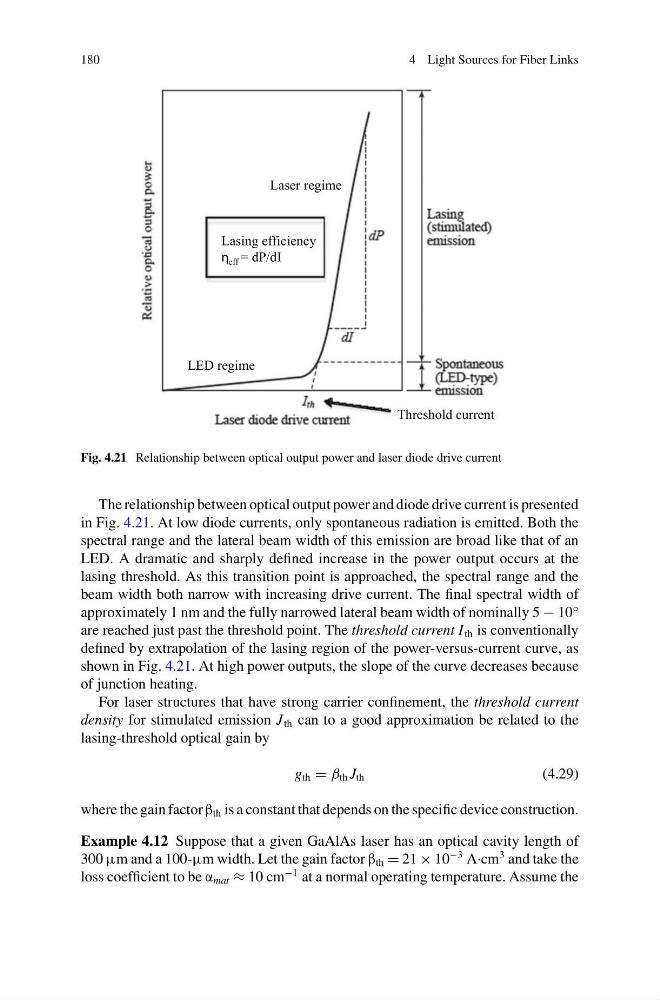
Fig. 4.21 Relationship between optical output power and laser diode drive current
The relationship between optical output power and diode drive current is presented
in Fig. 4.21. At low diode currents, only spontaneous radiation is emitted. Both the
spectral range and the lateral beam width of this emission are broad like that of an
LED. A dramatic and sharply defined increase in the power output occurs at the
lasing threshold. As this transition point is approached, the spectral range and the
beam width both narrow with increasing drive current. The final spectral width of
approximately 1 nm and the fully narrowed lateral beam width of nominally 5 − 10°
are reached just past the threshold point. The threshold current I th is conventionally
defined by extrapolation of the lasing region of the power-versus-current curve, as
shown in Fig. 4.21. At high power outputs, the slope of the curve decreases because
of junction heating.
For laser structures that have strong carrier confinement, the threshold current
density for stimulated emission J th can to a good approximation be related to the
lasing-threshold optical gain by
g th = β th J th
(4.29)
where the gain factor β th is a constant that depends on the specific device construction.
Example 4.12 Suppose that a given GaAlAs laser has an optical cavity length of
300 μm and a 100-μm width. Let the gain factor β th = 21 × 10
−3 A·cm
3 and take the
loss coefficient to be α mat ≈ 10 cm
−1 at a normal operating temperature. Assume the
4 Light Sources for Fiber Links
Lasing efficiency
η eff = dP/dI
Laser regime
LED regime
Threshold current
Fig. 4.21 Relationship between optical output power and laser diode drive current
The relationship between optical output power and diode drive current is presented
in Fig. 4.21. At low diode currents, only spontaneous radiation is emitted. Both the
spectral range and the lateral beam width of this emission are broad like that of an
LED. A dramatic and sharply defined increase in the power output occurs at the
lasing threshold. As this transition point is approached, the spectral range and the
beam width both narrow with increasing drive current. The final spectral width of
approximately 1 nm and the fully narrowed lateral beam width of nominally 5 − 10°
are reached just past the threshold point. The threshold current I th is conventionally
defined by extrapolation of the lasing region of the power-versus-current curve, as
shown in Fig. 4.21. At high power outputs, the slope of the curve decreases because
of junction heating.
For laser structures that have strong carrier confinement, the threshold current
density for stimulated emission J th can to a good approximation be related to the
lasing-threshold optical gain by
g th = β th J th
(4.29)
where the gain factor β th is a constant that depends on the specific device construction.
Example 4.12 Suppose that a given GaAlAs laser has an optical cavity length of
300 μm and a 100-μm width. Let the gain factor β th = 21 × 10
−3 A·cm
3 and take the
loss coefficient to be α mat ≈ 10 cm
−1 at a normal operating temperature. Assume the