

3.3 Design and Characteristics of SMFs
127
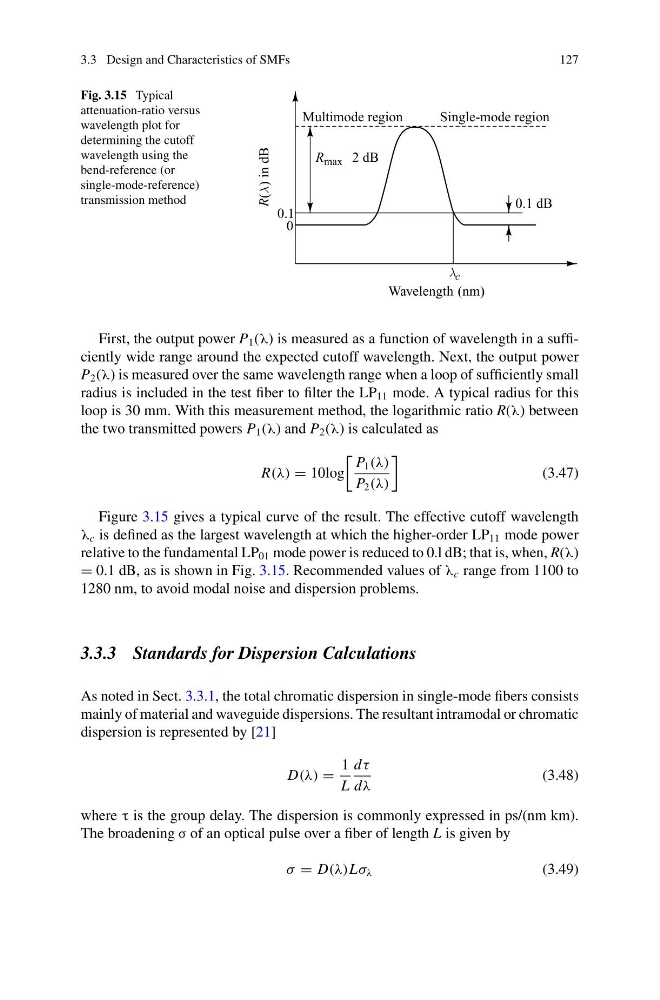
Fig. 3.15 Typical
attenuation-ratio versus
wavelength plot for
determining the cutoff
wavelength using the
bend-reference (or
single-mode-reference)
transmission method
First, the output power P 1 (λ) is measured as a function of wavelength in a sufficiently wide range around the expected cutoff wavelength. Next, the output power
P 2 (λ) is measured over the same wavelength range when a loop of sufficiently small
radius is included in the test fiber to filter the LP 11 mode. A typical radius for this
loop is 30 mm. With this measurement method, the logarithmic ratio R(λ) between
the two transmitted powers P 1 (λ) and P 2 (λ) is calculated as
R(λ) = 10log
P 1 (λ)
P 2 (λ)
(3.47)
Figure 3.15 gives a typical curve of the result. The effective cutoff wavelength
λ c is defined as the largest wavelength at which the higher-order LP 11 mode power
relative to the fundamental LP 01 mode power is reduced to 0.l dB; that is, when, R(λ)
= 0.1 dB, as is shown in Fig. 3.15. Recommended values of λ c range from 1100 to
1280 nm, to avoid modal noise and dispersion problems.
3.3.3 Standards for Dispersion Calculations
As noted in Sect. 3.3.1, the total chromatic dispersion in single-mode fibers consists
mainly of material and waveguide dispersions. The resultant intramodal or chromatic
dispersion is represented by [21]
D(λ) =
1
L
dτ
dλ
(3.48)
where τ is the group delay. The dispersion is commonly expressed in ps/(nm km).
The broadening σ of an optical pulse over a fiber of length L is given by
σ = D(λ)Lσ λ
(3.49)
127
Fig. 3.15 Typical
attenuation-ratio versus
wavelength plot for
determining the cutoff
wavelength using the
bend-reference (or
single-mode-reference)
transmission method
First, the output power P 1 (λ) is measured as a function of wavelength in a sufficiently wide range around the expected cutoff wavelength. Next, the output power
P 2 (λ) is measured over the same wavelength range when a loop of sufficiently small
radius is included in the test fiber to filter the LP 11 mode. A typical radius for this
loop is 30 mm. With this measurement method, the logarithmic ratio R(λ) between
the two transmitted powers P 1 (λ) and P 2 (λ) is calculated as
R(λ) = 10log
P 1 (λ)
P 2 (λ)
(3.47)
Figure 3.15 gives a typical curve of the result. The effective cutoff wavelength
λ c is defined as the largest wavelength at which the higher-order LP 11 mode power
relative to the fundamental LP 01 mode power is reduced to 0.l dB; that is, when, R(λ)
= 0.1 dB, as is shown in Fig. 3.15. Recommended values of λ c range from 1100 to
1280 nm, to avoid modal noise and dispersion problems.
3.3.3 Standards for Dispersion Calculations
As noted in Sect. 3.3.1, the total chromatic dispersion in single-mode fibers consists
mainly of material and waveguide dispersions. The resultant intramodal or chromatic
dispersion is represented by [21]
D(λ) =
1
L
dτ
dλ
(3.48)
where τ is the group delay. The dispersion is commonly expressed in ps/(nm km).
The broadening σ of an optical pulse over a fiber of length L is given by
σ = D(λ)Lσ λ
(3.49)