

48
J. Wu and H. Zhao
dynamic relationship between energy technology improvement and carbon emissions. It can be found that the literature on different topics has enriched and expanded
the STIRPAT model to different degrees in combination with its research needs. In
light of the main features in China’s urbanization process, the paper establishes the
following STIRPAT model:
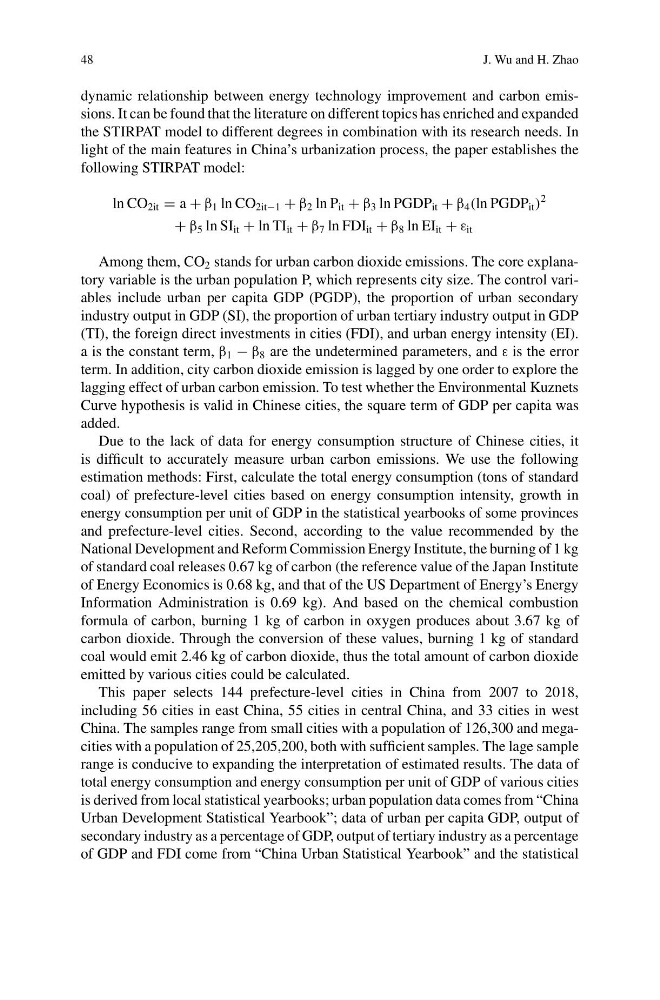
ln CO 2it = a + β 1 ln CO 2it−1 + β 2 ln P it + β 3 ln PGDP it + β 4 (ln PGDP it )
2
+ β 5 ln SI it + ln TI it + β 7 ln FDI it + β 8 ln EI it + ε it
Among them, CO 2 stands for urban carbon dioxide emissions. The core explanatory variable is the urban population P, which represents city size. The control variables include urban per capita GDP (PGDP), the proportion of urban secondary
industry output in GDP (SI), the proportion of urban tertiary industry output in GDP
(TI), the foreign direct investments in cities (FDI), and urban energy intensity (EI).
a is the constant term, β 1 − β 8 are the undetermined parameters, and ε is the error
term. In addition, city carbon dioxide emission is lagged by one order to explore the
lagging effect of urban carbon emission. To test whether the Environmental Kuznets
Curve hypothesis is valid in Chinese cities, the square term of GDP per capita was
added.
Due to the lack of data for energy consumption structure of Chinese cities, it
is difficult to accurately measure urban carbon emissions. We use the following
estimation methods: First, calculate the total energy consumption (tons of standard
coal) of prefecture-level cities based on energy consumption intensity, growth in
energy consumption per unit of GDP in the statistical yearbooks of some provinces
and prefecture-level cities. Second, according to the value recommended by the
National Development and Reform Commission Energy Institute, the burning of 1 kg
of standard coal releases 0.67 kg of carbon (the reference value of the Japan Institute
of Energy Economics is 0.68 kg, and that of the US Department of Energy’s Energy
Information Administration is 0.69 kg). And based on the chemical combustion
formula of carbon, burning 1 kg of carbon in oxygen produces about 3.67 kg of
carbon dioxide. Through the conversion of these values, burning 1 kg of standard
coal would emit 2.46 kg of carbon dioxide, thus the total amount of carbon dioxide
emitted by various cities could be calculated.
This paper selects 144 prefecture-level cities in China from 2007 to 2018,
including 56 cities in east China, 55 cities in central China, and 33 cities in west
China. The samples range from small cities with a population of 126,300 and megacities with a population of 25,205,200, both with sufficient samples. The lage sample
range is conducive to expanding the interpretation of estimated results. The data of
total energy consumption and energy consumption per unit of GDP of various cities
is derived from local statistical yearbooks; urban population data comes from “China
Urban Development Statistical Yearbook”; data of urban per capita GDP, output of
secondary industry as a percentage of GDP, output of tertiary industry as a percentage
of GDP and FDI come from “China Urban Statistical Yearbook” and the statistical
J. Wu and H. Zhao
dynamic relationship between energy technology improvement and carbon emissions. It can be found that the literature on different topics has enriched and expanded
the STIRPAT model to different degrees in combination with its research needs. In
light of the main features in China’s urbanization process, the paper establishes the
following STIRPAT model:
ln CO 2it = a + β 1 ln CO 2it−1 + β 2 ln P it + β 3 ln PGDP it + β 4 (ln PGDP it )
2
+ β 5 ln SI it + ln TI it + β 7 ln FDI it + β 8 ln EI it + ε it
Among them, CO 2 stands for urban carbon dioxide emissions. The core explanatory variable is the urban population P, which represents city size. The control variables include urban per capita GDP (PGDP), the proportion of urban secondary
industry output in GDP (SI), the proportion of urban tertiary industry output in GDP
(TI), the foreign direct investments in cities (FDI), and urban energy intensity (EI).
a is the constant term, β 1 − β 8 are the undetermined parameters, and ε is the error
term. In addition, city carbon dioxide emission is lagged by one order to explore the
lagging effect of urban carbon emission. To test whether the Environmental Kuznets
Curve hypothesis is valid in Chinese cities, the square term of GDP per capita was
added.
Due to the lack of data for energy consumption structure of Chinese cities, it
is difficult to accurately measure urban carbon emissions. We use the following
estimation methods: First, calculate the total energy consumption (tons of standard
coal) of prefecture-level cities based on energy consumption intensity, growth in
energy consumption per unit of GDP in the statistical yearbooks of some provinces
and prefecture-level cities. Second, according to the value recommended by the
National Development and Reform Commission Energy Institute, the burning of 1 kg
of standard coal releases 0.67 kg of carbon (the reference value of the Japan Institute
of Energy Economics is 0.68 kg, and that of the US Department of Energy’s Energy
Information Administration is 0.69 kg). And based on the chemical combustion
formula of carbon, burning 1 kg of carbon in oxygen produces about 3.67 kg of
carbon dioxide. Through the conversion of these values, burning 1 kg of standard
coal would emit 2.46 kg of carbon dioxide, thus the total amount of carbon dioxide
emitted by various cities could be calculated.
This paper selects 144 prefecture-level cities in China from 2007 to 2018,
including 56 cities in east China, 55 cities in central China, and 33 cities in west
China. The samples range from small cities with a population of 126,300 and megacities with a population of 25,205,200, both with sufficient samples. The lage sample
range is conducive to expanding the interpretation of estimated results. The data of
total energy consumption and energy consumption per unit of GDP of various cities
is derived from local statistical yearbooks; urban population data comes from “China
Urban Development Statistical Yearbook”; data of urban per capita GDP, output of
secondary industry as a percentage of GDP, output of tertiary industry as a percentage
of GDP and FDI come from “China Urban Statistical Yearbook” and the statistical