

42
J. Wu and H. Zhao
basis. The second stage refers to the rapid advancement period from 1995 to 2010,
which saw the transition from local urbanization to migration urbanization, when the
country has initially put in place and improved the socialist market economy. And
urbanization jumped from 29.0% to 50.0%, reaching the 50% demarcation, up 1.39%
on average year-on-year. The third stage lasts from the end of 2010 to now, with fast
growth and slight slowdown, when local and migration urbanization developing in
tandem amidst all-out further reform in China (Li & Cai 2015). Urbanization grew
from 50.0% to 59.58% during this period, registering an average yearly growth of
1.2%, slightly down from the previous stage.
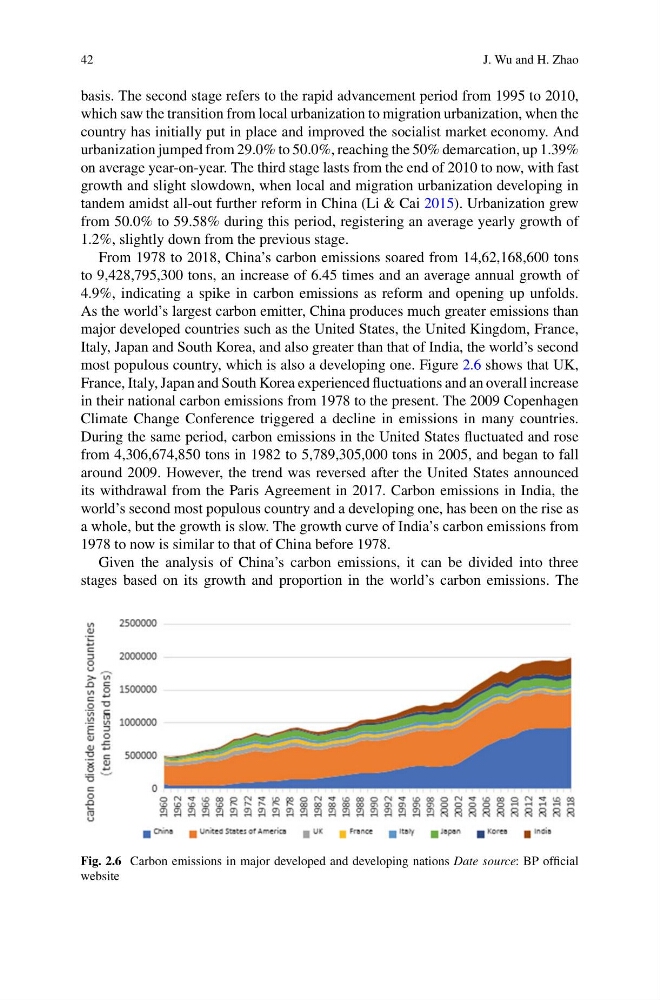
From 1978 to 2018, China’s carbon emissions soared from 14,62,168,600 tons
to 9,428,795,300 tons, an increase of 6.45 times and an average annual growth of
4.9%, indicating a spike in carbon emissions as reform and opening up unfolds.
As the world’s largest carbon emitter, China produces much greater emissions than
major developed countries such as the United States, the United Kingdom, France,
Italy, Japan and South Korea, and also greater than that of India, the world’s second
most populous country, which is also a developing one. Figure 2.6 shows that UK,
France, Italy, Japan and South Korea experienced fluctuations and an overall increase
in their national carbon emissions from 1978 to the present. The 2009 Copenhagen
Climate Change Conference triggered a decline in emissions in many countries.
During the same period, carbon emissions in the United States fluctuated and rose
from 4,306,674,850 tons in 1982 to 5,789,305,000 tons in 2005, and began to fall
around 2009. However, the trend was reversed after the United States announced
its withdrawal from the Paris Agreement in 2017. Carbon emissions in India, the
world’s second most populous country and a developing one, has been on the rise as
a whole, but the growth is slow. The growth curve of India’s carbon emissions from
1978 to now is similar to that of China before 1978.
Given the analysis of China’s carbon emissions, it can be divided into three
stages based on its growth and proportion in the world’s carbon emissions. The
Fig. 2.6 Carbon emissions in major developed and developing nations Date source: BP official
website
J. Wu and H. Zhao
basis. The second stage refers to the rapid advancement period from 1995 to 2010,
which saw the transition from local urbanization to migration urbanization, when the
country has initially put in place and improved the socialist market economy. And
urbanization jumped from 29.0% to 50.0%, reaching the 50% demarcation, up 1.39%
on average year-on-year. The third stage lasts from the end of 2010 to now, with fast
growth and slight slowdown, when local and migration urbanization developing in
tandem amidst all-out further reform in China (Li & Cai 2015). Urbanization grew
from 50.0% to 59.58% during this period, registering an average yearly growth of
1.2%, slightly down from the previous stage.
From 1978 to 2018, China’s carbon emissions soared from 14,62,168,600 tons
to 9,428,795,300 tons, an increase of 6.45 times and an average annual growth of
4.9%, indicating a spike in carbon emissions as reform and opening up unfolds.
As the world’s largest carbon emitter, China produces much greater emissions than
major developed countries such as the United States, the United Kingdom, France,
Italy, Japan and South Korea, and also greater than that of India, the world’s second
most populous country, which is also a developing one. Figure 2.6 shows that UK,
France, Italy, Japan and South Korea experienced fluctuations and an overall increase
in their national carbon emissions from 1978 to the present. The 2009 Copenhagen
Climate Change Conference triggered a decline in emissions in many countries.
During the same period, carbon emissions in the United States fluctuated and rose
from 4,306,674,850 tons in 1982 to 5,789,305,000 tons in 2005, and began to fall
around 2009. However, the trend was reversed after the United States announced
its withdrawal from the Paris Agreement in 2017. Carbon emissions in India, the
world’s second most populous country and a developing one, has been on the rise as
a whole, but the growth is slow. The growth curve of India’s carbon emissions from
1978 to now is similar to that of China before 1978.
Given the analysis of China’s carbon emissions, it can be divided into three
stages based on its growth and proportion in the world’s carbon emissions. The
Fig. 2.6 Carbon emissions in major developed and developing nations Date source: BP official
website