

226
L. Ren et al.
0
3
6
9
12
15
18
21
24
0
5
10
15
20
25
30
35
40
GJ/t
EJ
Coal
Oil
Gas
Electricity
Imported heat
Bioenergy
Energy intensity
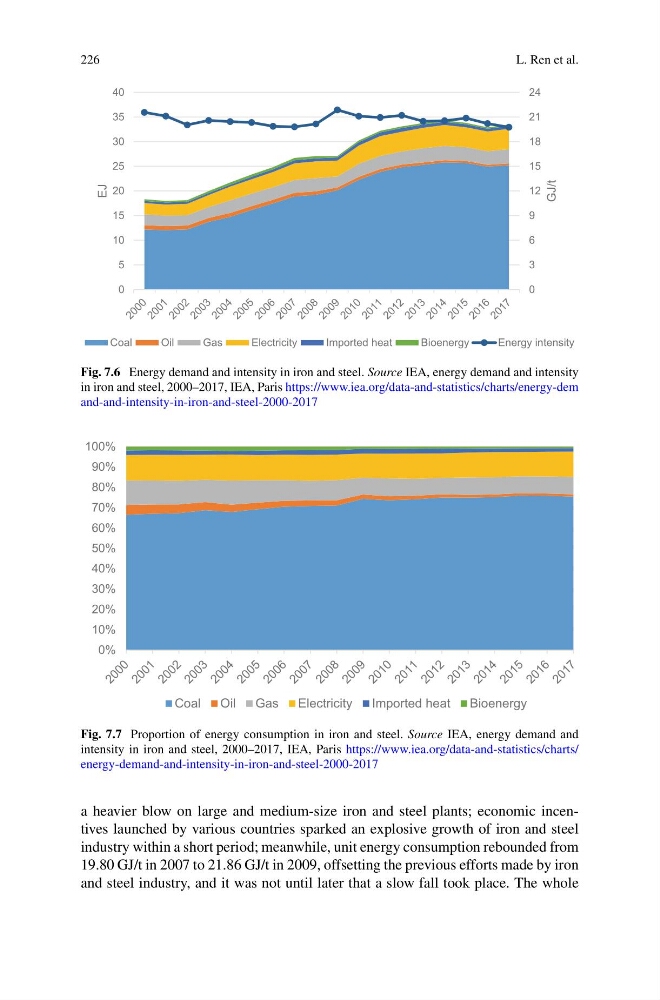
Fig. 7.6 Energy demand and intensity in iron and steel. Source IEA, energy demand and intensity
in iron and steel, 2000–2017, IEA, Paris https://www.iea.org/data-and-statistics/charts/energy-dem
and-and-intensity-in-iron-and-steel-2000-2017
0%
10%
20%
30%
40%
50%
60%
70%
80%
90%
100%
Coal
Oil
Gas
Electricity
Imported heat
Bioenergy
Fig. 7.7 Proportion of energy consumption in iron and steel. Source IEA, energy demand and
intensity in iron and steel, 2000–2017, IEA, Paris https://www.iea.org/data-and-statistics/charts/
energy-demand-and-intensity-in-iron-and-steel-2000-2017
a heavier blow on large and medium-size iron and steel plants; economic incentives launched by various countries sparked an explosive growth of iron and steel
industry within a short period; meanwhile, unit energy consumption rebounded from
19.80 GJ/t in 2007 to 21.86 GJ/t in 2009, offsetting the previous efforts made by iron
and steel industry, and it was not until later that a slow fall took place. The whole
L. Ren et al.
0
3
6
9
12
15
18
21
24
0
5
10
15
20
25
30
35
40
GJ/t
EJ
Coal
Oil
Gas
Electricity
Imported heat
Bioenergy
Energy intensity
Fig. 7.6 Energy demand and intensity in iron and steel. Source IEA, energy demand and intensity
in iron and steel, 2000–2017, IEA, Paris https://www.iea.org/data-and-statistics/charts/energy-dem
and-and-intensity-in-iron-and-steel-2000-2017
0%
10%
20%
30%
40%
50%
60%
70%
80%
90%
100%
Coal
Oil
Gas
Electricity
Imported heat
Bioenergy
Fig. 7.7 Proportion of energy consumption in iron and steel. Source IEA, energy demand and
intensity in iron and steel, 2000–2017, IEA, Paris https://www.iea.org/data-and-statistics/charts/
energy-demand-and-intensity-in-iron-and-steel-2000-2017
a heavier blow on large and medium-size iron and steel plants; economic incentives launched by various countries sparked an explosive growth of iron and steel
industry within a short period; meanwhile, unit energy consumption rebounded from
19.80 GJ/t in 2007 to 21.86 GJ/t in 2009, offsetting the previous efforts made by iron
and steel industry, and it was not until later that a slow fall took place. The whole