

5 Reality and Challenges of China’s Water Resources Management …
173
0
1200
2400
3600
4800
6000
0
240000
480000
720000
960000
1200000
2004 2006 2008 2010 2012 2014 2016 2018
DWC (100 million cu.m)
GNI (100 million Yuan)
GNI
DWC
DWC
GNI
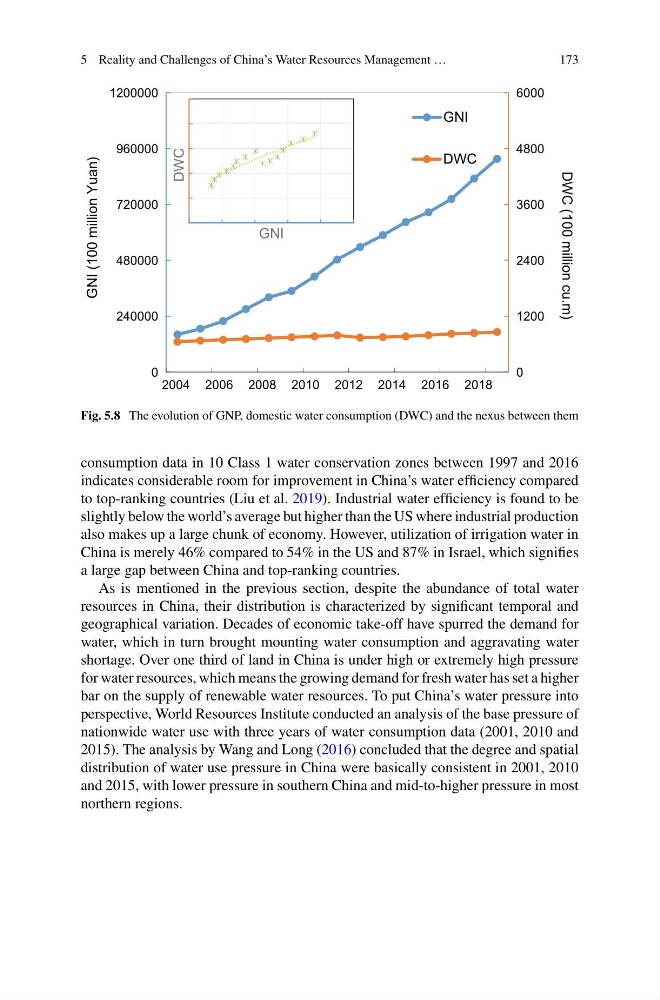
Fig. 5.8 The evolution of GNP, domestic water consumption (DWC) and the nexus between them
consumption data in 10 Class 1 water conservation zones between 1997 and 2016
indicates considerable room for improvement in China’s water efficiency compared
to top-ranking countries (Liu et al. 2019). Industrial water efficiency is found to be
slightly below the world’s average but higher than the US where industrial production
also makes up a large chunk of economy. However, utilization of irrigation water in
China is merely 46% compared to 54% in the US and 87% in Israel, which signifies
a large gap between China and top-ranking countries.
As is mentioned in the previous section, despite the abundance of total water
resources in China, their distribution is characterized by significant temporal and
geographical variation. Decades of economic take-off have spurred the demand for
water, which in turn brought mounting water consumption and aggravating water
shortage. Over one third of land in China is under high or extremely high pressure
for water resources, which means the growing demand for fresh water has set a higher
bar on the supply of renewable water resources. To put China’s water pressure into
perspective, World Resources Institute conducted an analysis of the base pressure of
nationwide water use with three years of water consumption data (2001, 2010 and
2015). The analysis by Wang and Long (2016) concluded that the degree and spatial
distribution of water use pressure in China were basically consistent in 2001, 2010
and 2015, with lower pressure in southern China and mid-to-higher pressure in most
northern regions.
173
0
1200
2400
3600
4800
6000
0
240000
480000
720000
960000
1200000
2004 2006 2008 2010 2012 2014 2016 2018
DWC (100 million cu.m)
GNI (100 million Yuan)
GNI
DWC
DWC
GNI
Fig. 5.8 The evolution of GNP, domestic water consumption (DWC) and the nexus between them
consumption data in 10 Class 1 water conservation zones between 1997 and 2016
indicates considerable room for improvement in China’s water efficiency compared
to top-ranking countries (Liu et al. 2019). Industrial water efficiency is found to be
slightly below the world’s average but higher than the US where industrial production
also makes up a large chunk of economy. However, utilization of irrigation water in
China is merely 46% compared to 54% in the US and 87% in Israel, which signifies
a large gap between China and top-ranking countries.
As is mentioned in the previous section, despite the abundance of total water
resources in China, their distribution is characterized by significant temporal and
geographical variation. Decades of economic take-off have spurred the demand for
water, which in turn brought mounting water consumption and aggravating water
shortage. Over one third of land in China is under high or extremely high pressure
for water resources, which means the growing demand for fresh water has set a higher
bar on the supply of renewable water resources. To put China’s water pressure into
perspective, World Resources Institute conducted an analysis of the base pressure of
nationwide water use with three years of water consumption data (2001, 2010 and
2015). The analysis by Wang and Long (2016) concluded that the degree and spatial
distribution of water use pressure in China were basically consistent in 2001, 2010
and 2015, with lower pressure in southern China and mid-to-higher pressure in most
northern regions.