

154
Z. Lu and G. Zhu
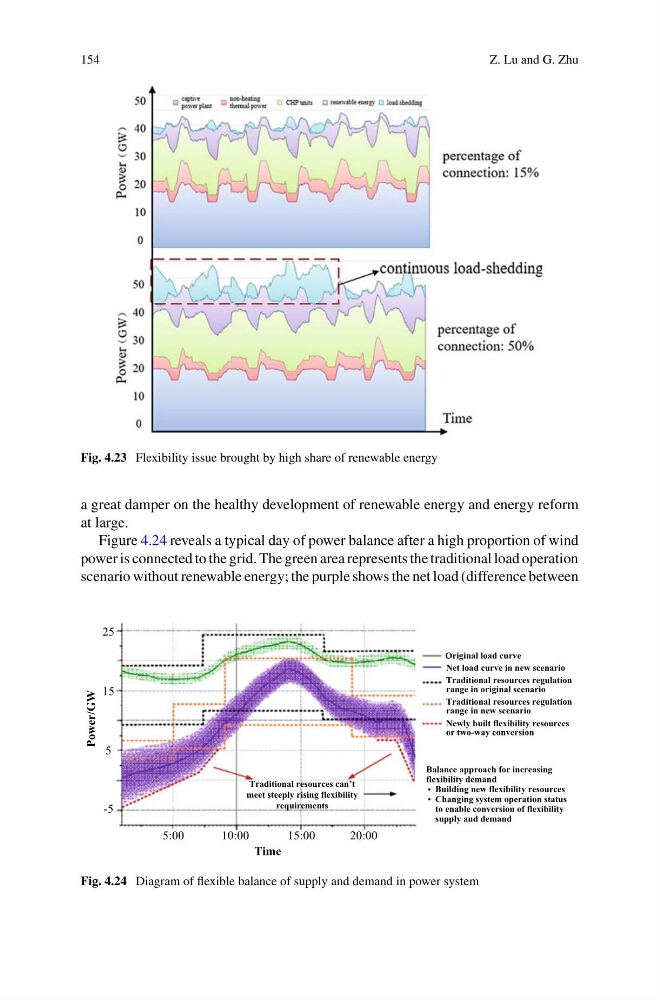
Fig. 4.23 Flexibility issue brought by high share of renewable energy
a great damper on the healthy development of renewable energy and energy reform
at large.
Figure 4.24 reveals a typical day of power balance after a high proportion of wind
power is connected to the grid. The green area represents the traditional load operation
scenario without renewable energy; the purple shows the net load (difference between
Traditional resources can’t
meet steeply rising flexibility
requirements
-5
5
15
25
Power/GW
Original load curve
Net load curve in new scenario
Traditional resources regulation
range in original scenario
Traditional resources regulation
range in new scenario
Newly built flexibility resources
or two-way conversion
Balance approach for increasing
flexibility demand
Building new flexibility resources
Changing system operation status
to enable conversion of flexibility
supply and demand
Time
5:00
10:00
15:00
20:00
Fig. 4.24 Diagram of flexible balance of supply and demand in power system
Z. Lu and G. Zhu
Fig. 4.23 Flexibility issue brought by high share of renewable energy
a great damper on the healthy development of renewable energy and energy reform
at large.
Figure 4.24 reveals a typical day of power balance after a high proportion of wind
power is connected to the grid. The green area represents the traditional load operation
scenario without renewable energy; the purple shows the net load (difference between
Traditional resources can’t
meet steeply rising flexibility
requirements
-5
5
15
25
Power/GW
Original load curve
Net load curve in new scenario
Traditional resources regulation
range in original scenario
Traditional resources regulation
range in new scenario
Newly built flexibility resources
or two-way conversion
Balance approach for increasing
flexibility demand
Building new flexibility resources
Changing system operation status
to enable conversion of flexibility
supply and demand
Time
5:00
10:00
15:00
20:00
Fig. 4.24 Diagram of flexible balance of supply and demand in power system